Last week was the period everyone had been waiting for as the retail showrooms opened their doors to car buyers for the first time since Lockdown was introduced on January 5th 2021, following a period of regional lockdowns and restrictions in late 2020. The question was whether there would be a release of pent-up demand for cars or not and the answer would appear to be a resounding yes. Online enquiries for new and used cars have increased further in the last week and the retailers have been actively booking test drives and customer visits, welcoming prospective buyers to the socially distanced showrooms that are the “new normal”.
This level of demand might be a surprise for some retailers who were recording online sales levels as being around 80% of normal during the lockdown, but this will certainly be a welcome boost. On the other hand, online only retailers might be concerned that the increased interest in online fulfilment might wain and affect their sales volumes as consumers rediscover the benefit of the test drive experience and showroom dealing. At the same time as sales have jumped up, some misguided retailers appear to have been offering discounts on used cars. This may yield results in the short term, but at reduced profit levels and as a result immediately pose difficulties in sourcing replacement used car stock where the wholesale market is still struggling to get back up to speed.
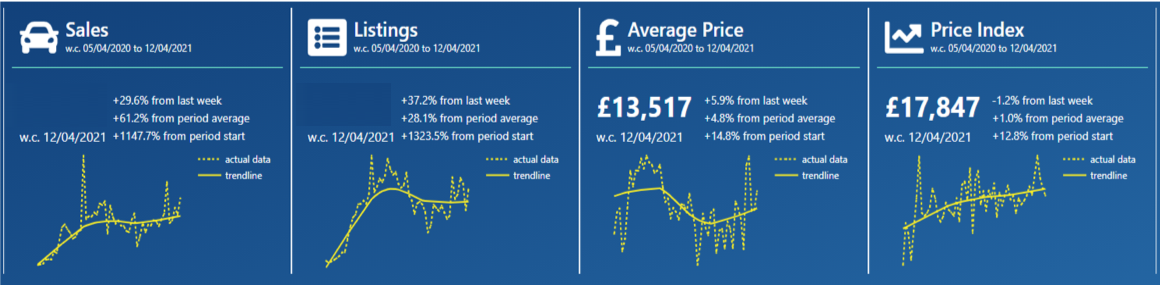
The charts below qualify the market dynamics over the last 7 days in comparison to the previous week with full year data shown at the bottom in yellow: –
Data powered by Cazana
The data clearly shows that used car sales since the April 12th re-opening day have improved by +29.6% over the previous week which is a splendid result. With other non-essential retail outlets open there was speculation that any bounce back might have been inhibited by other retail alternatives being open but this is a sterling result. At the same time, new retail advert listings jumped by +37.2% which on the face of it sounds wonderful but it is worth remembering that they dropped by -32% the week beforehand so the net gain is around 5%. It is wise to consider this whilst also thinking about how difficult sourcing replacement used car stock will become over the coming weeks.
One other point to be highlighted is the huge jump in year on year sales volumes and new retail advert listings highlighted in the full period data in the yellow charts. In comparison with sales volumes during Lockdown 1 a year ago there has been an uplift of some +1147% in sales and the +1323% in new listings which given the extraordinarily low online sales capacity and ban on collection of cars for anything other than key workers explains these vast gains.
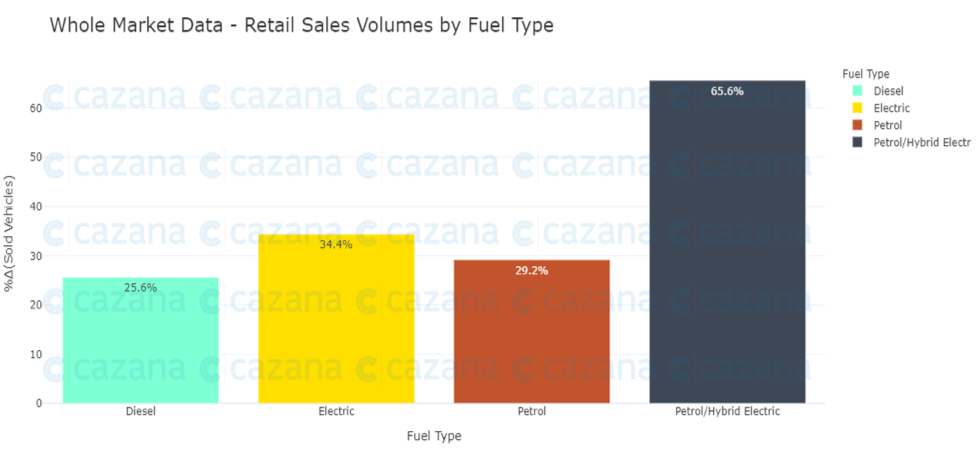
Given the big change in the sales volumes, it is important to understand a little more about how this has happened. In reviewing the data in more detail, it was found that the volume of sales by fuel type highlighted an interesting nuance as detailed in the chart below: –
Data powered by Cazana
This chart clearly shows that week on week there has been a significant +65.6% increase in sales of petrol/hybrid cars over the previous week. This suggests that perhaps those buyers that were uncomfortable buying a used car online have now gone to the freshly opened showrooms and are also those who are more interested in environmental matters than the average used car buyer who is happy to buy online. More research into the data is needed to find the true meaning and impact on the market of this nuance, although it raises some interesting questions over buyer profiling and demand patterns.
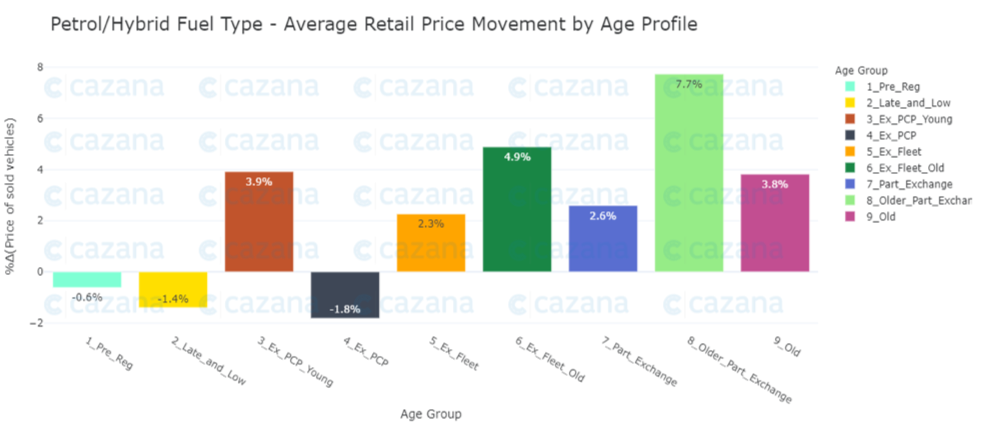
With this in mind, the chart below looks a little further into the market performance by looking at what happened with retail pricing week on week for Petrol Hybrid cars: –
Data powered by Cazana
The more detailed the insight the more facts are revealed, and this chart shows that from a pricing perspective it was the Older Part Exchange profile that experienced the largest increase in retail pricing at +7.7% week on week. The question is, what does this growth of petrol hybrid sales in the 7 years and older age profile mean, and will there be a specific shortage of stock for this type of car. It would also be prudent to take the investigation of the data further and seek to understand the proportional representation of the total market when looking at this insight. However, realtime retail driven insight is key to revealing the reason for the nuances in the market.
To summarise, the last week has been a significant boost to the used car market and it has been marvellous to see the retail car showrooms open and full of customers and staff once more. It would be nice to think that the coming weeks will show similar a sales performance. The potential risk here is that the volume of used cars in the wholesale market will not be sufficient to satisfy consumer demand. This is an opportunity for the retailers to catch up on lost revenue from the recent months of lockdown and discounting used cars is an unwise practice when the market is so buoyant. Cazana realtime retail driven insight will ensure that retailers and wholesale remarketers know exactly where retail demand is best at exactly the right time to ensure the best ROI on stock and assets.
