The first full week of activity in the automotive sector for April 2021, was not as positive as many would have hoped for and was a step back on the previous weeks trading. There were similar levels of consumer leads coming into the retailers, although it would seem that there was less eagerness for the customers to commit to buying at this point. The general opinion is that this is because car buyers are holding off until April 12th so that they can come and see the car and test drive it in person before making a commitment to buy, which is an interesting and perhaps accurate perspective.
There is another viewpoint that is less palatable for businesses to admit, and that is that there has been a drop-in sales team commitment and workload capacity. This was the last week before showrooms reopening and for many businesses and team members this was the week that staff returned to work for the first time in weeks. This final period before opening may have been used for staff training and a re-acquaintance with once familiar surroundings. Either way, the coming days will show whether this was a customer or operationally driven decline in sales performance.
The charts below qualify the market dynamics over the last 7 days in comparison to the previous week with full-year data shown at the bottom in yellow: –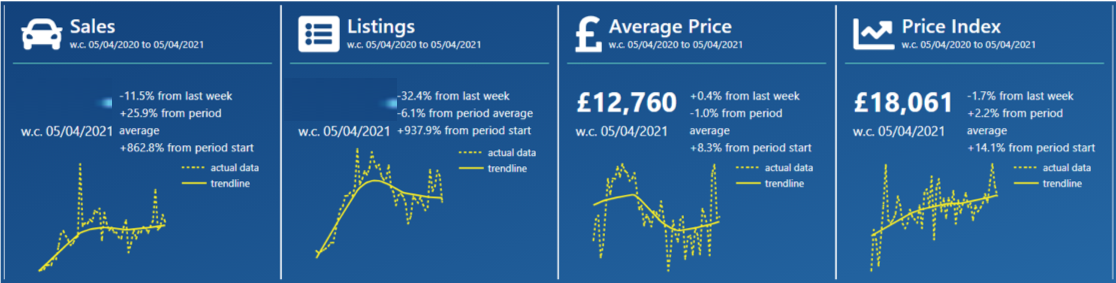
Data powered by Cazana
The last seven days recorded a drop in sales of -11.5% which is disappointing as discussed. In addition to this, there was a reduction in the number of fresh used car retail advert listings of -32.4% which is a large drop in relation to the volume that were placed in the previous week. However, this is less of a concern given that it reflects the fact that small and mid-size retailers have been bringing their used car stock levels back up to capacity. In some cases, small to mid-size retailers had been running with lower inventory levels during the lockdown as their online sales capability was not facilitating enough revenue to keep stock at normal capacity.
From a retail pricing perspective, the Average Retail Price of a used car improved by +0.4% overall showing a good level of stability. However, the Cazana Used Car Retail Price Index reflects a normalised view of the market and shows a moderate decrease of -1.7%. It is worth noting that during the total data period from April 5th 2020 to April 5th 2021, the Cazana Used Car Retail Price Index increased by 14.1%.
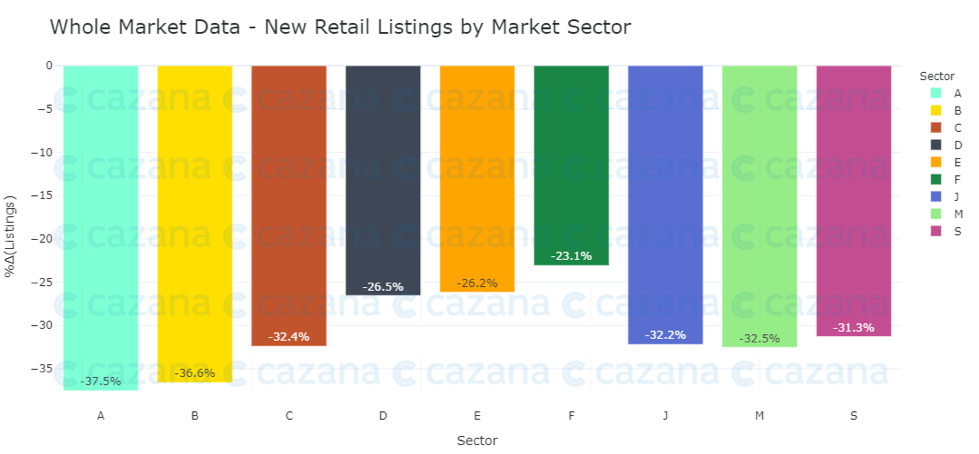
In consideration of the big drop in the number of fresh used car retail advert listings in the last week, it is important to understand why this may have happened and seek to discover whether any specific trends may signal a problem within the market. Looking at new listings by fuel type shows that the decline was pretty consistent, with the delta running between a drop of -29.1% of BEVs to -34% of Petrol cars. Perhaps of more interest is the view of what happened in the last week by Market Sector as shown in the chart below: –
Data powered by Cazana
It is evident from this chart that the largest decline in new retail advert listings has affected the smaller cars where the volume of new A sector Superminis dropped by -37.5% although this represents just 4.2% of the total market. The largest market share belongs to the J Sector or SUVs with 26.6% and that showed a decline of -32.2% in fresh advert listings closely followed C Sector or Medium Cars that represents 23.1% of the market and new advert listings declined by -32.4%. The fact that the market sectors with the greatest share of total volume moved similarly is both a comfort and a reflection that this drop was a preparation of stock levels before the Showrooms reopening.
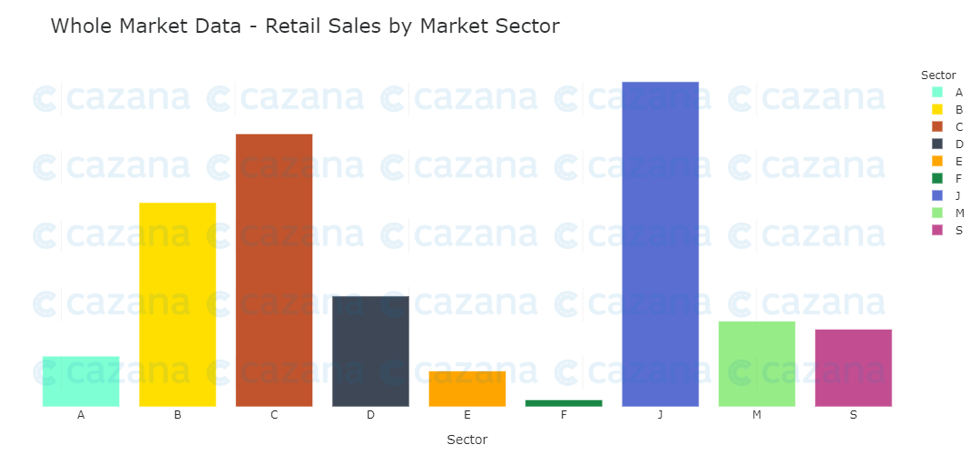
With Market Sector in mind, the chart below looks at the volume of sales in the previous week: –
Data powered by Cazana
This chart is interesting as it is a different lens on market activity and allows transparency on the balance of vehicles on offer for sale in the market against the sale volumes by market sector. The positive news comes from the fact that for the A and B sector cars, where sales were lower, and the number of new retail advert listings declined more than others suggests that the lower number of new retail adverts in the market should not be too much of a stock constriction issue for the retail buyer. On the flip side, the high volume of J Sector sales combined with the low volume of new retail listings in the first bar chart could mean that there is a potential stock availability issue looming, and that could affect sales volumes and profitability for retailers. At the same time, it could be good news for remarketers with the right type of used cars to put into the wholesale market, although unless the remarketers use retail driven insight, they would struggle to identify what might be a short-term window of opportunity to maximise on the asset return.
Therefore, the last week has been a little disappointing from a performance perspective and the hope is that this was a short-term impact of the return to work of furloughed staff. There is also the possibility that this was the beginning of the automotive retail sector returning to a customer-facing sales environment. The lockdown period has proven the industry can operate online and that the customer has the confidence to buy cars online. The question is whether old school habits will return or whether the industry has learnt a valuable lesson. Either way, realtime market insight and dynamic retail driven pricing will be key to successful auto retailing.
