The last week of March saw an uplift in sales for both new and used cars as consumer confidence took another step forward whilst business confidence dipped. Over the month, new car registrations recorded an uplift of 11.5% over March 2020 with Fleet and Business registrations the benefactors, despite a drop-in business confidence. Private buyer registrations were down -4.1%. Some interesting dynamics at play clearly, although the positive take is that registrations are now down just -12% year to date which is excellent.
Sales in the used car market have been particularly positive too and this has been off the back of high levels of leads and the return of sales staff from Furlough in readiness for the showrooms reopening on April 12th. The question is whether the positive used car sales levels will continue in the final week before lockdown restrictions are lifted. The coming weeks will be remarkably interesting and are likely to give a better indication of what the future used car market will look like by showing the potential durability of online sales and delivery models where showrooms are fully open for business.
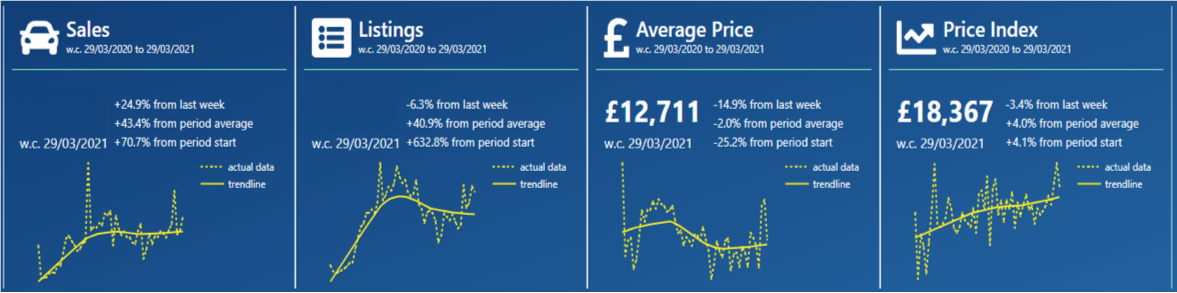
The charts below qualify the market performance over the last 7 days in comparison to the previous week with full year data shown at the bottom in yellow: –
Data powered by Cazana
The charts show that the volume of used car sales increased by +24.9% over the previous week which is a significant achievement. At the same time, the volume of newly listed vehicles dropped by -6.3% which may be a sign of restricted used car stock availability which was a concern highlighted by Cazana some weeks ago. As the retail market gets busier in the coming weeks and the remarketing and logistics operations ramp up activity once again, this could become quite an issue and understanding the level of retail consumer demand daily will be key to ensuring retail pricing is correct in the marketplace.
From a retail pricing perspective, the Average Retail Price dropped by -14.9% overall which is cause for further investigation. The more stable Cazana Used Car Price Index reflects a normalised view of the market which shows a decrease in the retail price of -3.4%.
It is also important to highlight the changes in the period trend data that is shown on each chart. The market is now a full year on from the onset of the first lockdown in March 2020 and the devastating drops in both sales and new listing volumes are reflected in the full-year data. Sales Levels have increased by +70% over the last year and new Retail Listings by an astonishing 632%. The context is that this time last year there was extremely limited sales activity at all, with only key workers allowed to purchase online and have their car delivered to their door or collect in a very socially distanced manner.
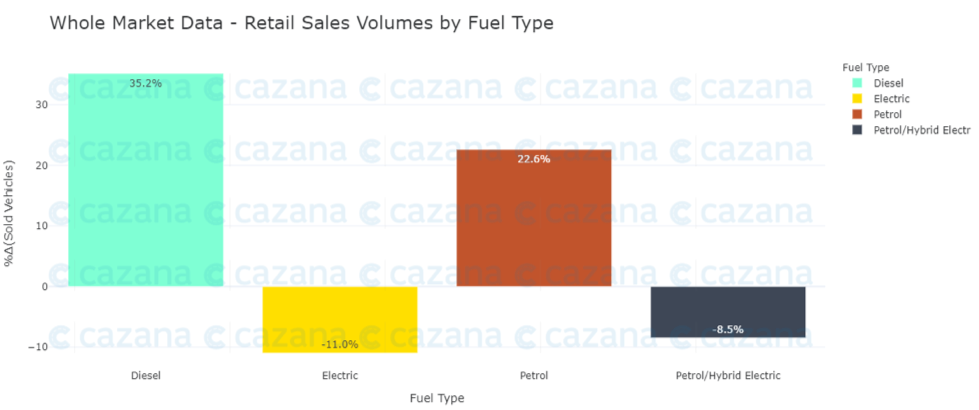
Given the significant rise in the number of used car Retail Sales in the previous week, the chart below looks at this in more detail: –
Data powered by Cazana
This chart is interesting as it highlights the change in used car sales volumes by fuel type week on week, and it is clear that there has been a marked increase in sales of ICE cars. At the same time, there has been a dip in sales of BEVs and Hybrids. Combine this view of the market with the previous market headline charts and this would suggest that there has been a demand for higher-priced ICE cars as this combination would account for the drop in average retail price and slight tail off on the Cazana Used Car Price Index.
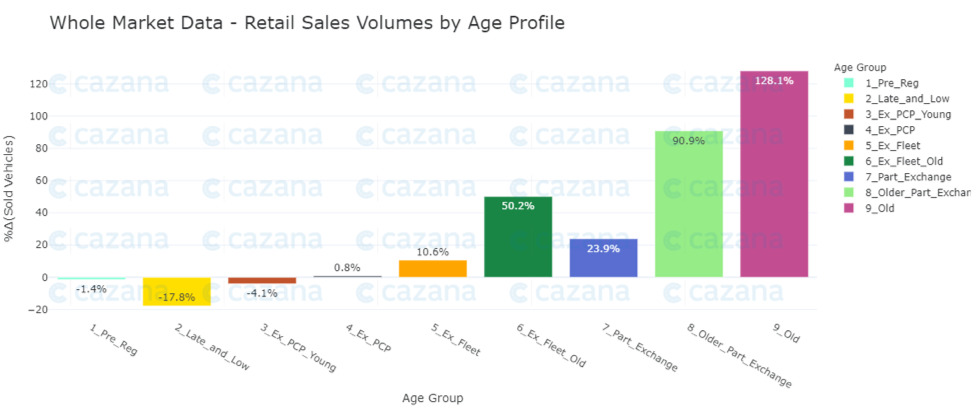
The chart below looks at the market in more detail and puts a lens on used car sales by age profile: –
Data powered by Cazana
As a general trend, there has been an upturn in sales of used cars over the age of 3 years but it is clear that there has been a significant increase in sales of the Old car age profile with an upturn of +128.1% over the previous week. The Older Part Exchange profile is not far behind recording an increase of +90.9% and overall this is a very interesting market trend. This could signify that as the country approaches a return to a new normal where social distancing will still be in place, there remains a consumer demand for old cars as a substitute for travelling on public transport. Alternatively, given that the data indicates it is more expensive ICE cars that have been sold, this could be demand for cars to be used to travel more widely in the UK as the foreign travel industry looks set to remain closed for some months.
In conclusion, the last week has seen some remarkably interesting and positive sales activity in both the new and used car markets. With sales enquiries increasing in volume and the right staff now back from furlough to service them, it was not a surprise that sales increased especially when the end of the 3rd and hopefully final lockdown period is so near at hand. The question is whether as the showrooms open there will be a significant boost in sales as a result of pent-up demand with the “accidental saver” looking to spend their money. Whatever the outcome, the need for realtime whole market data remains imperative to drive good commercial decisions within businesses nationwide.
