After a surge in sales volumes following the conclusion of the Euro 2020 competition, the automotive sector saw a return to a more normal level of activity across both the new and used car markets during the week commencing July 26th. Given that this is also the summer holiday period when many consumers have elected to do battle with the UK weather and inflated accommodation pricing, the market tail off has perhaps been lighter than it could have been.
Of more concern is what is happening with the supply of used car stock and the difficulty the retailers are having in trying to source replacement cars for the forecourts, many of which are already at a lower than ideal capacity right now. It is possible that this uncomfortable situation will ease in the coming weeks although this is far from certain, as the new car stock availability continues to constrict the number of new cars coming to the market. The release of the SMMT new car registration data later this week is eagerly awaited, as the data will highlight which OEMs have struggled the most and at the same time, give an indication of those that have switched production to model ranges with better profit margins to try and replace lost revenue from lower overall sales volumes from less profitable cars. The lack of both semiconductors and other parts required for the industry has not improved and shows little sign of doing so in the short term.
The panels below highlight the market dynamics during the week commencing July 26th in comparison to the previous week. At the same time, they show the full year trend of the stated data period shown in the charts at the bottom of each panel: -
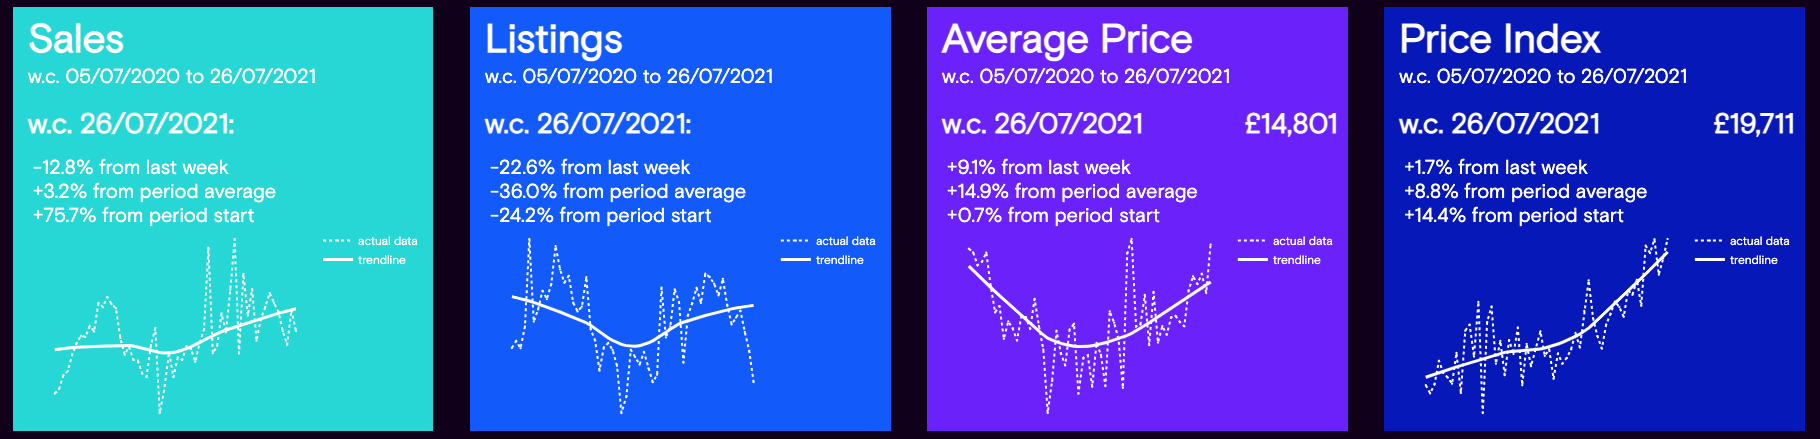
Data powered by Cazana.
The data shows that used car sales for the last week dropped by -12.8% which on the face of it seems a fairly large shift for the worse, although it is important to remember that the previous week had seen an increase of +26.8%. In addition, the sales volume for the full data period from July 5th 2020 reveals a climb of +75.7% albeit during a period of extreme market conditions. The expectation is that sales will now stabilise for the coming month or so, although this will be dependent on the potential for foreign travel, and the consumer appetite for spending on leisure pursuits during the rest of the summer.
From a retail pricing perspective, the news is positive with the Cazana Used Car Retail Price Index increasing by +1.7%, reflecting a total increase of +14.4% from the full data period that started in July 2020. The trendline shows an upward pattern, although the dotted line showing movements by week reveals a stabilisation in the very aggressive changes seen during the last 12 months. The raw data that reflects the average retail price of a car shows a lift of +9.1% which is quite a large jump, and this would indicate more valuable cars in the current used car market.
It is key to acknowledge that new retail advert listings have dropped by a worrying level in the last week moving downwards by -22.6%. This is likely to be a direct reflection of the lower volumes of cars in the wholesale market overall. Whilst some auction houses have experienced a drop in volume, third party remarketing platforms have also been finding it tough to find stock to offer to the wholesale buyers. This is of concern as consumers that are not able to find the car they are looking for may decide to defer purchase until there is more choice.
With this decline in replacement cars becoming a trend, the chart below looks at the volume of new retail adverts over the last 3 months on a week-by-week basis: -
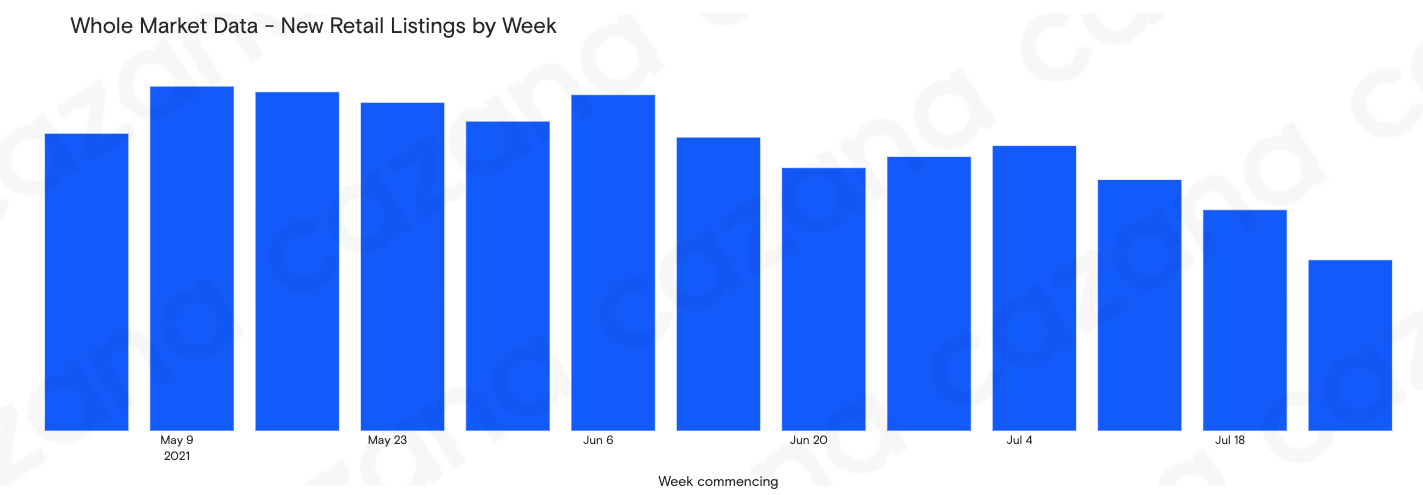
Data powered by Cazana.
This chart clearly shows that there has been a marked downward trend in new retail advert listings since the beginning of May 2021. The market would expect to see a level of seasonality in this data over the course of a full year, but this pattern is not what would be expected during the mid part of a normal 12 month period. Understanding the detail in this data is essential to be able to plan business strategy effectively and Cazana are able to reveal critical data patterns for customers via bespoke reporting solutions.
Taking a closer look at the market as a whole, the chart below shows what has happened to the volume of Live Retail Adverts in the market in the last 3 months: -
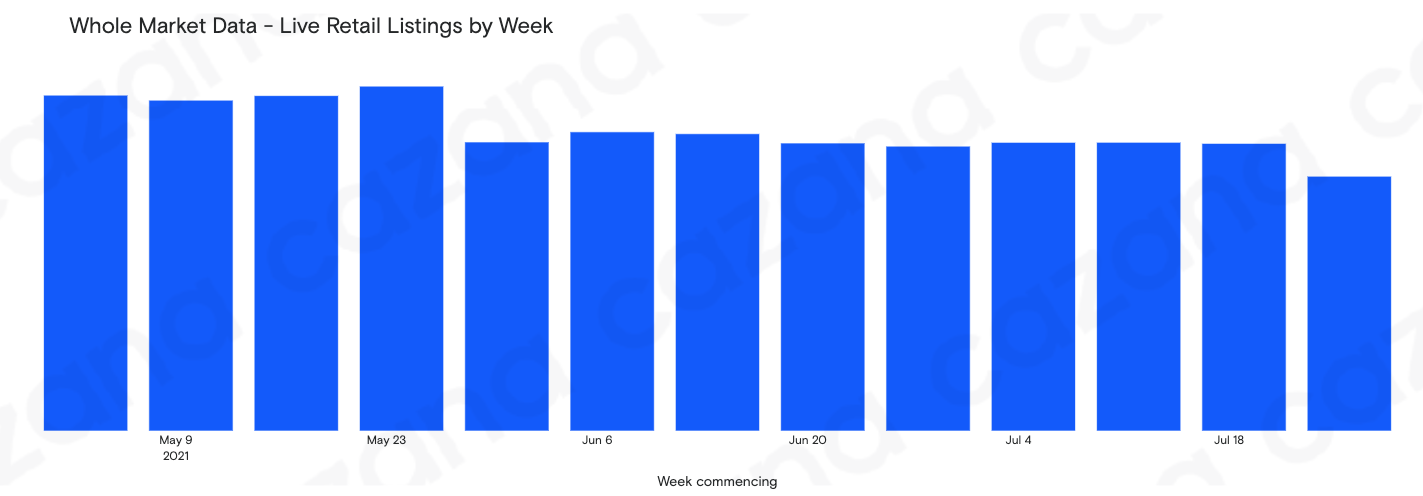
Data powered by Cazana.
The data in the chart qualifies the impact of the reduction in new retail advert listings that was shown in the earlier chart and needs to be considered in context with the run of used car sales volumes in recent weeks. It is evident that despite declining sales volumes, the volume of new retail adverts coming to the market is not sufficient to sustain stability in the total number of live listings. Once more, clarity on the data behind this high-level view is essential to understand what market sectors and price profiles are being affected and to what extent.
To summarise, the market in the last week has seen a decline in sales, which on the face of it looks quite significant, though it is important to note that this did come off the back of a pretty buoyant previous week. However, the biggest market concern must be the shrinking volume of new retail advert listings and the resulting drop in the number of live listings in the used car market, both of which are on mid-term downward trends. The position is very difficult to cope with at the best of times, but it is essential that dynamic realtime market data is used to identify both problems and opportunities. Cazana are ideally placed to reveal the truth in the market nuances and help improve transparency, awareness and profit.
