The first week of September is always an interesting period for car retailers. Historically the new car order banks would have been full, and the dealer site loaded with new cars ready to be handed to their new owners. Used car sales teams would normally have been very quiet and any used cars sold in the first week would take some time to get prepared for handover as the whole site would have been focused on shifting new cars. Even non franchised retailers have a slower time of things in the first week or two of September and it feels as if consumer interest in used cars grinds to a halt.
The reality this year has been somewhat different as new car supply constraints have put retailers in a difficult position, being unable to meet the internal budget targets as well as those set by the OEMs earlier in the year. As a result, for some there will be no volume bonus this quarter thus leaving a hole in the accounts. But for others, the lack of new business activity has given them the opportunity to focus a little more closely on used car sales. This is not an ideal time for used car business, with children heading back to school and many parents going back to work for the first time in a while. Car buying can sometimes be quite a way down the list of priorities, but indications are that sales performance was reasonably good, all things considered.
The panels below highlight the key market performance points during the week commencing September 6th in comparison to the previous week. The bottom of each of the panels shows the full year insight trend of the stated data period with a solid line, and the dotted line depicts a week-by-week view: -

Data powered by Cazana.
After the previous week’s drop of -11.8% in used car sales volumes, it is encouraging to see that the market has gained a little more strength and sales for the week commencing September 6th have increased by +2.8%. The full year picture shows used car sales +26.2% higher than in the first week of September 2020 which is quite astonishing. At the same time, the number of new retail advert listings has shown a considerable improvement, with +27.8% more new retail adverts appearing in the market. As such, it is not difficult to work out that the overall volume of new listings in the market has also increased as sales have not balanced against the number of used cars added to the forecourts, although this is probably a good thing as used car stock levels were exceedingly low for some retailers.
From a retail pricing perspective, the Cazana Used Car Retail Price Index saw a nominal +0.2% increase lifting the price to £20,321. This maintains the upward momentum but is lower than the market has become used to in recent weeks and months. That said, the Cazana Used Car Retail Price Index is +16.5% higher than it was at the beginning of August 2020. Looking at the raw average price of a used car and once more the gain has been very small at just +0.5% which recovers part of the -1.5% dip from the previous week and takes the average price of a used car to £15,311.
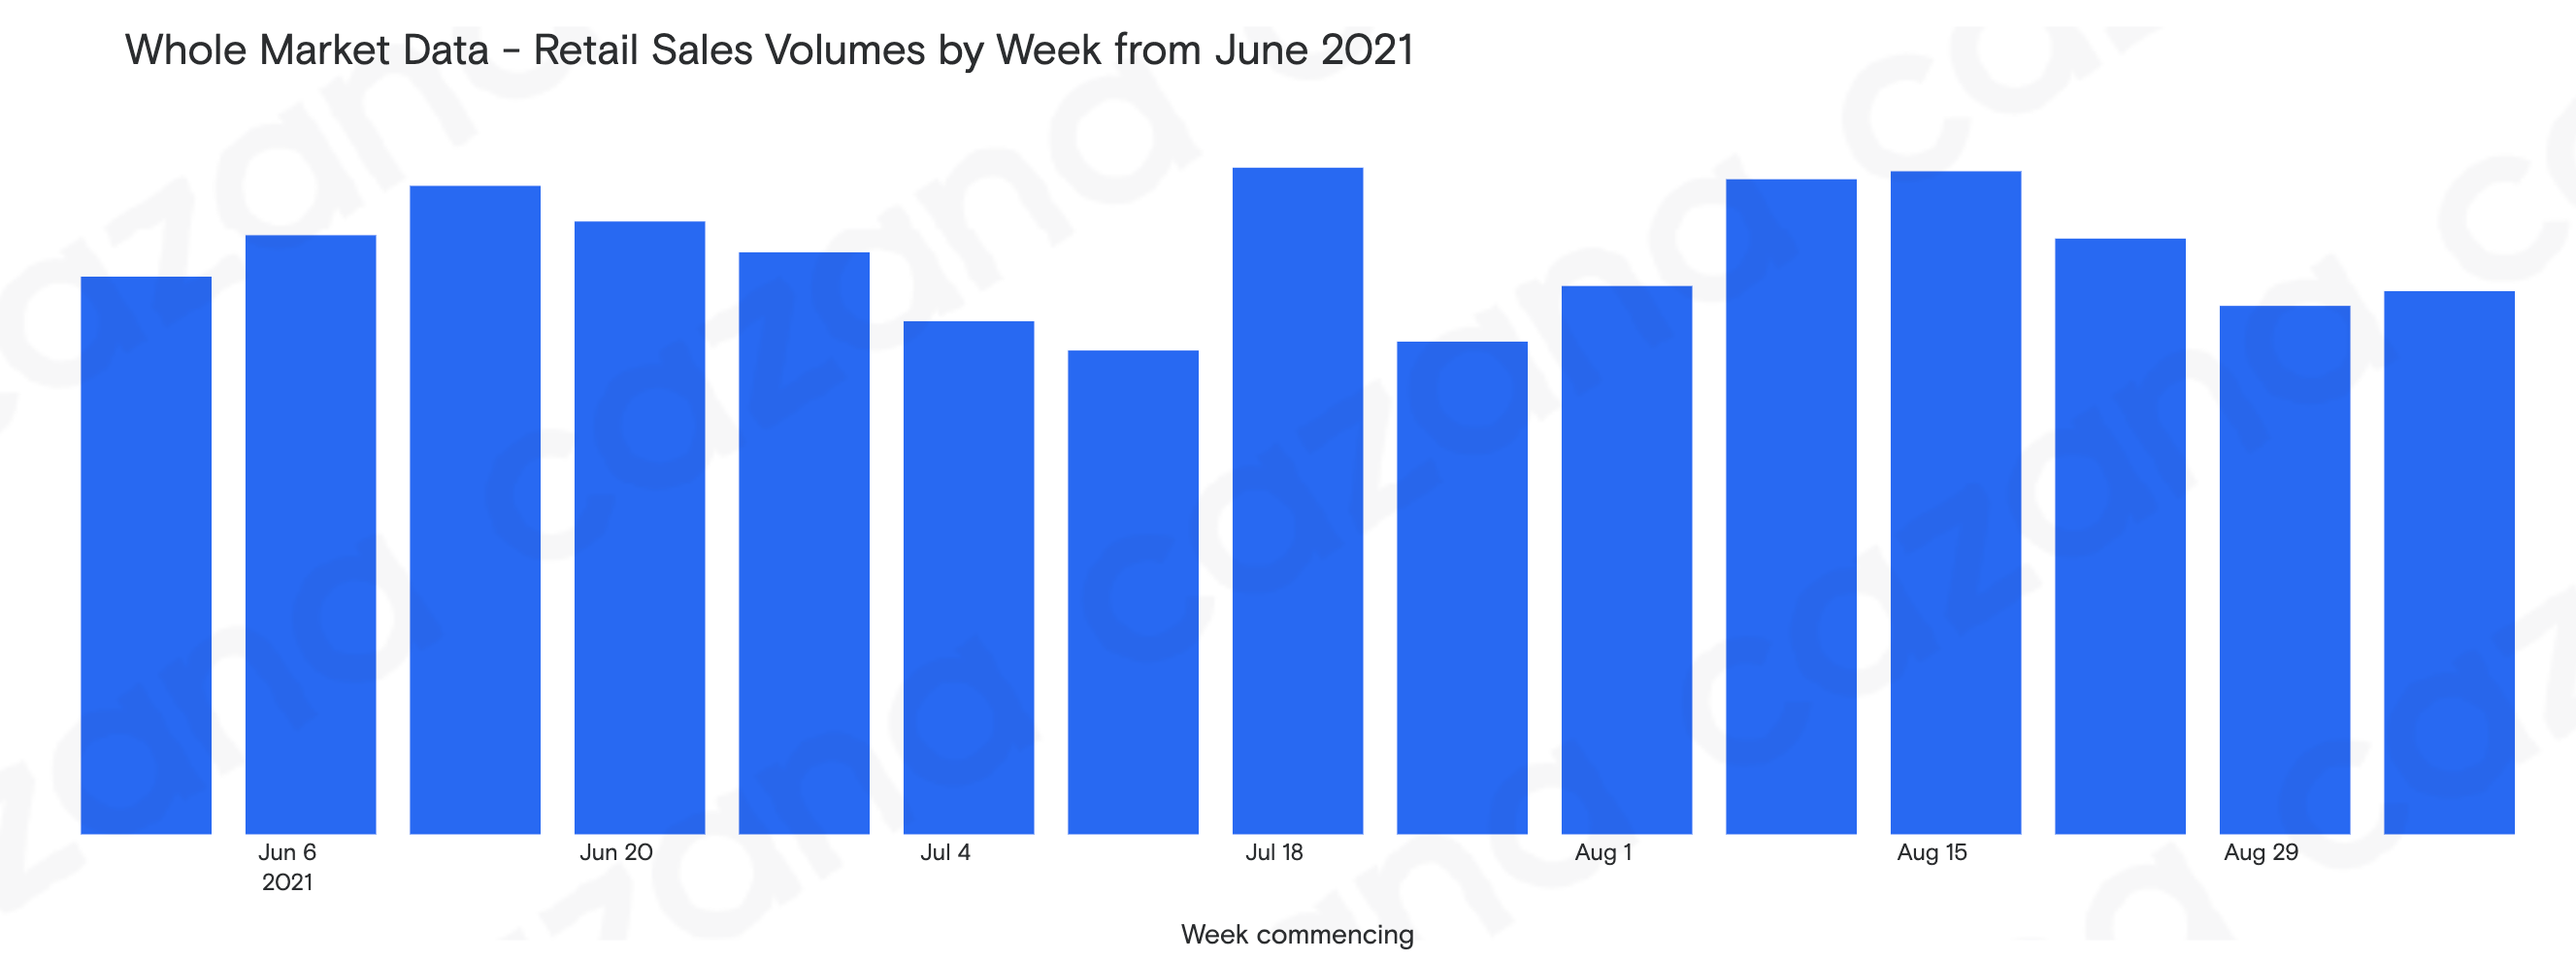
With used car sales improving slightly the chart below spotlights the trend in sales since the beginning of June on a week-by-week basis: -

Data powered by Cazana.
The chart above is very interesting as it qualifies the recent pattern in used car sales. As can clearly be seen, there is a cyclical rise and fall in the volume of used cars sold week on week and month on month. The data shows that the middle of the month records the greatest volume of sales, with a tail off as the period draws to a close. There is a train of thought that this may relate to the view that pricing at the beginning of the month is always lower than the previous month, although in today’s world of modern auto retailing that is not the case at all as retail pricing moves both up and down on a daily basis.
What is of greater interest is looking at the data in detail and analysing this pattern by OEM and then at model range level. This brings a unique view of sales strengths and opportunities that can be very useful as part of developing a robust dynamic and profitable used car strategy.
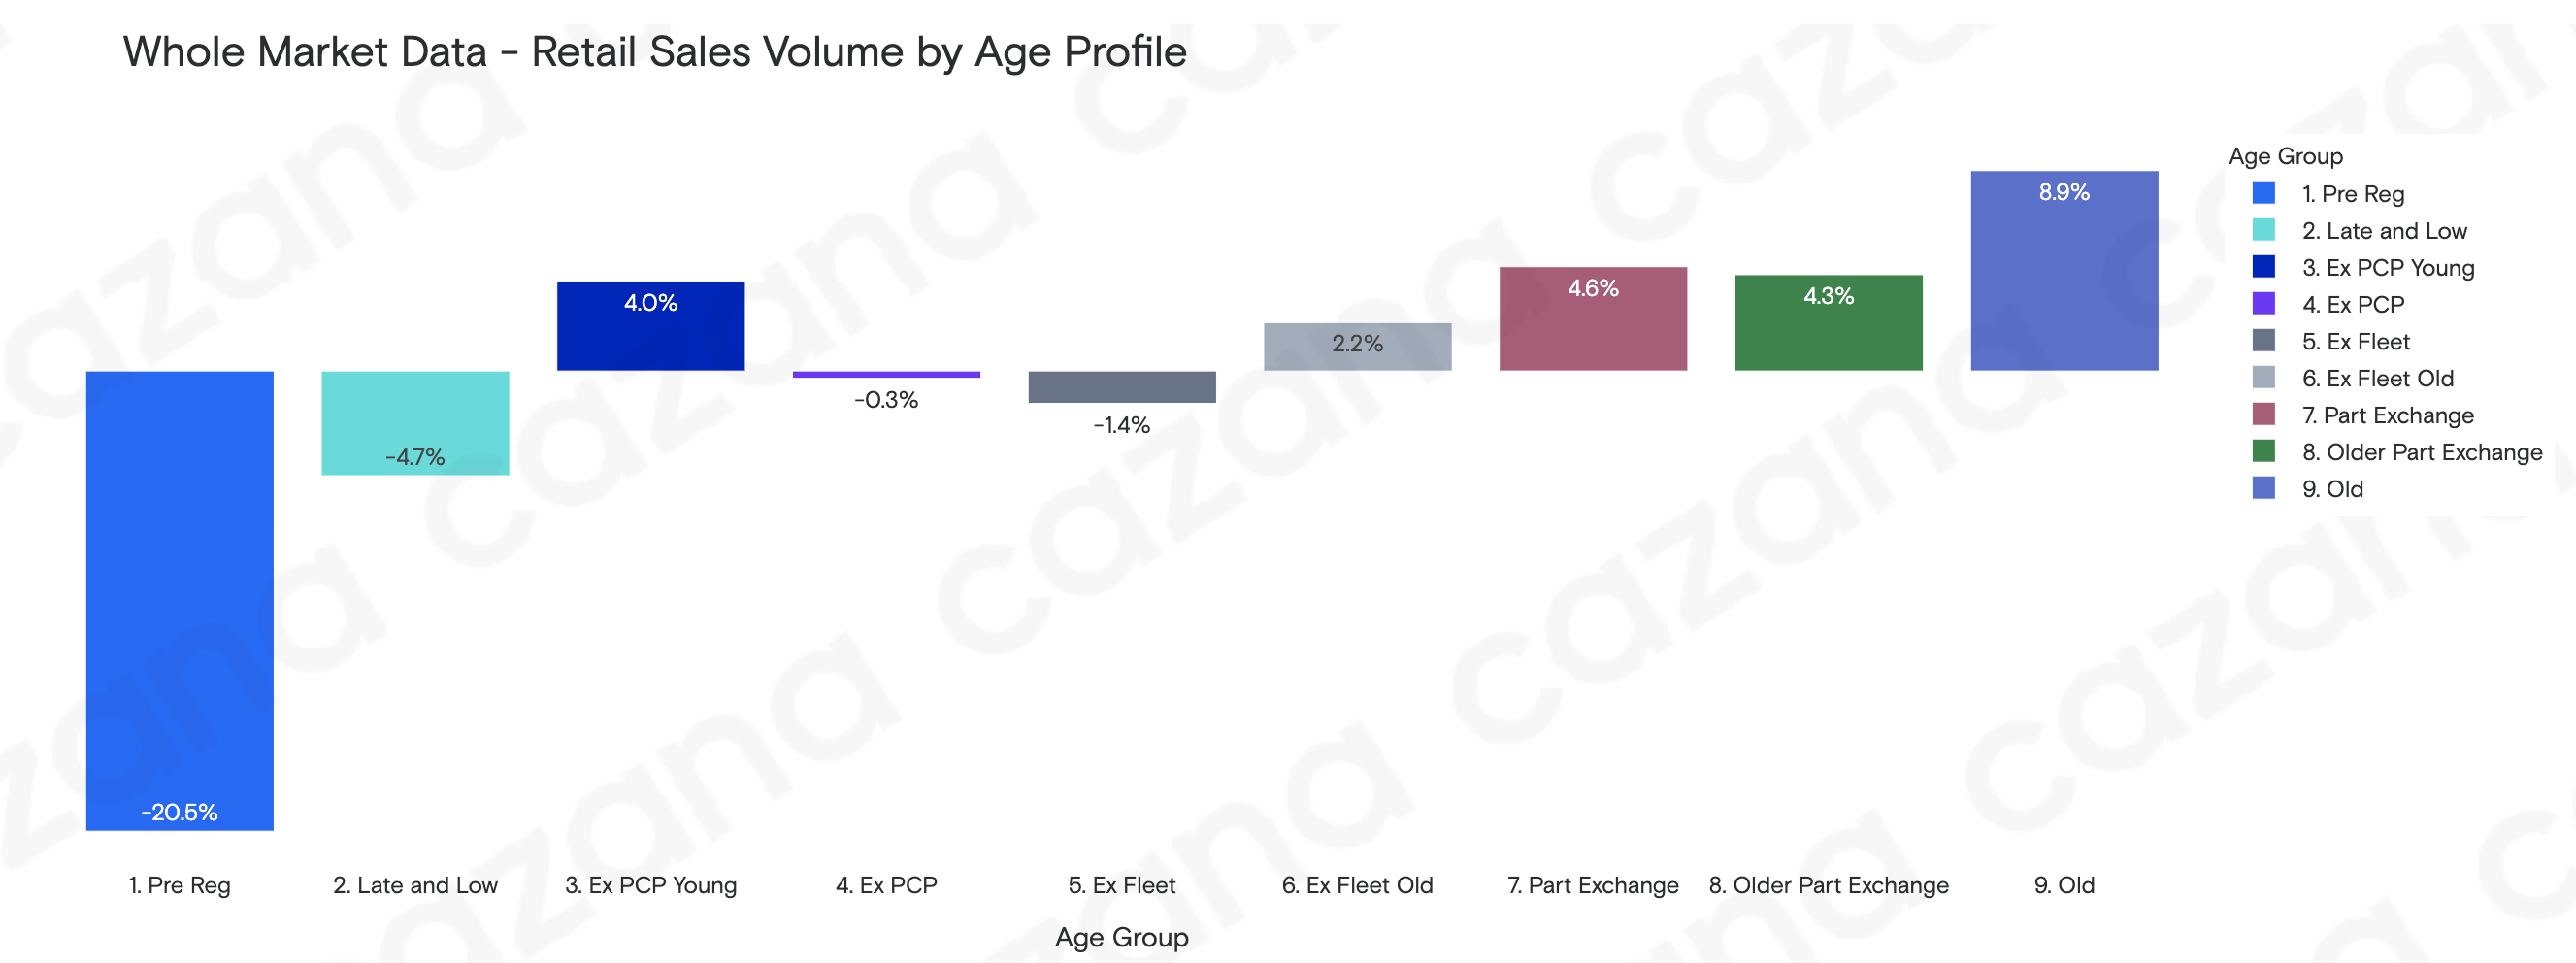
The final chart below puts a lens on sales activity week on week by age profile: -

Data powered by Cazana.
The data in this chart qualifies which age profile has seen the greatest benefit in the increase in sales in the week commencing September 6th. Of specific note is the further drop in the volume of Pre Reg profile cars being sold and this is due to the lack of new car stock in the market precluding the need to create pre registered stock. At the opposite end of the age span is the Old Car sector which enjoyed a pick up of +8.9% in used car sales over the previous week and this perpetuates the volatility of this profile of cars. It is also interesting to see that the growth in used car sales has been predominantly focused on cars over 5 years old in the last week.
In summary, activity in the automotive sector has been slightly better in the last week than it was in the previous week, with used car sales increasing at a time of the year that is usually dominated by new car sales. Consumer enquiry levels are at an acceptable level and the sales teams are functioning well converting enquiries to sales. If there is anything to be wary of, it is the +27.8% increase in the number of new retail adverts that came to the market which also boosted the number of live retail listings on sale, although it is worth noting that the first week of August 2021 also saw a big jump in new retail adverts. As such, the coming week’s activity will be interesting to review in due course. Live retail driven insight such as the Cazana data is essential to help retailers, lenders and remarketing companies understand exactly what is happening in the market and daily insight can identify the best opportunities for improved profitability.