With the end of the month of August falling in the last week, retailer focus would normally shift from used car sales to new car sales on the arrival of the new registration plate although this year is likely to have to be somewhat different given the ongoing shortage of new car stock in the UK and across many of the global markets. The latest SMMT new car registration data reflected a tricky new car market position with volumes for the month of August 2021 down -22% on the previous year taking the year-to-date figure to rest at +20.3% over the decidedly disrupted 2020 period. There is no respite in sight at the moment.
The used car market tailed off too as is often the case at this time of year and the volume of used car sales enquiries diminished leaving sales teams having to work that bit harder to capture the sale. Making the customer happy was more difficult and this will in part have been due to the choice of used car stock currently available. The retailers are finding it increasingly difficult to find their choice of used cars to offer to the customer and to make matters worse vendors are not refurbing the cars in the trade to the same standards they were earlier in the year quite simply because they don’t need to. Retailers can no longer be picky and are being pressured to fill the empty forecourts with stock of almost any kind.
The panels below highlight the key market performance points during the week commencing August 30th in comparison to the previous week. At the same time, the bottom of the panels also show the full year insight trend of the stated data period, with a solid line and the dotted line depicts a week-by-week view:-

Data powered by Cazana.
The Cazana whole market retail-based insight clearly shows that used car sales for the week dipped by -11.3%, although it is worth noting that this figure is +1.6% above average for the full 12-month data period. In addition, it is +22.8% higher than the same week in 2020 so whilst the headline data is negative the overall position is positive. New retail listings on the other hand show a different perspective with a drop of -8.4% on the previous week. In relation to the same period last year the volume of new retail adverts is down a worrying -42.8%. and this supports the anecdotal market commentary that used car stock is becoming more and more difficult to find in the wholesale market right now.
Looking at retail pricing and the average retail price of a car in its raw terms dipped by -1.5% from the previous week taking the figure to £15,241. This is +4.4% higher than the same period last year. Once this data is normalised the Cazana Used Car Retail Price Index also shows a decline, but of a nominal-0.6% in relation to the previous week. Looking at the same period last year, and the overall £20,282 is actually +16.3% higher than it was this time last year and this is a significant difference.
Considering the quite unique market dynamics at the moment, the chart below looks at what has happened to the volume of live retail listings during the course of the last year on a week-by-week basis:
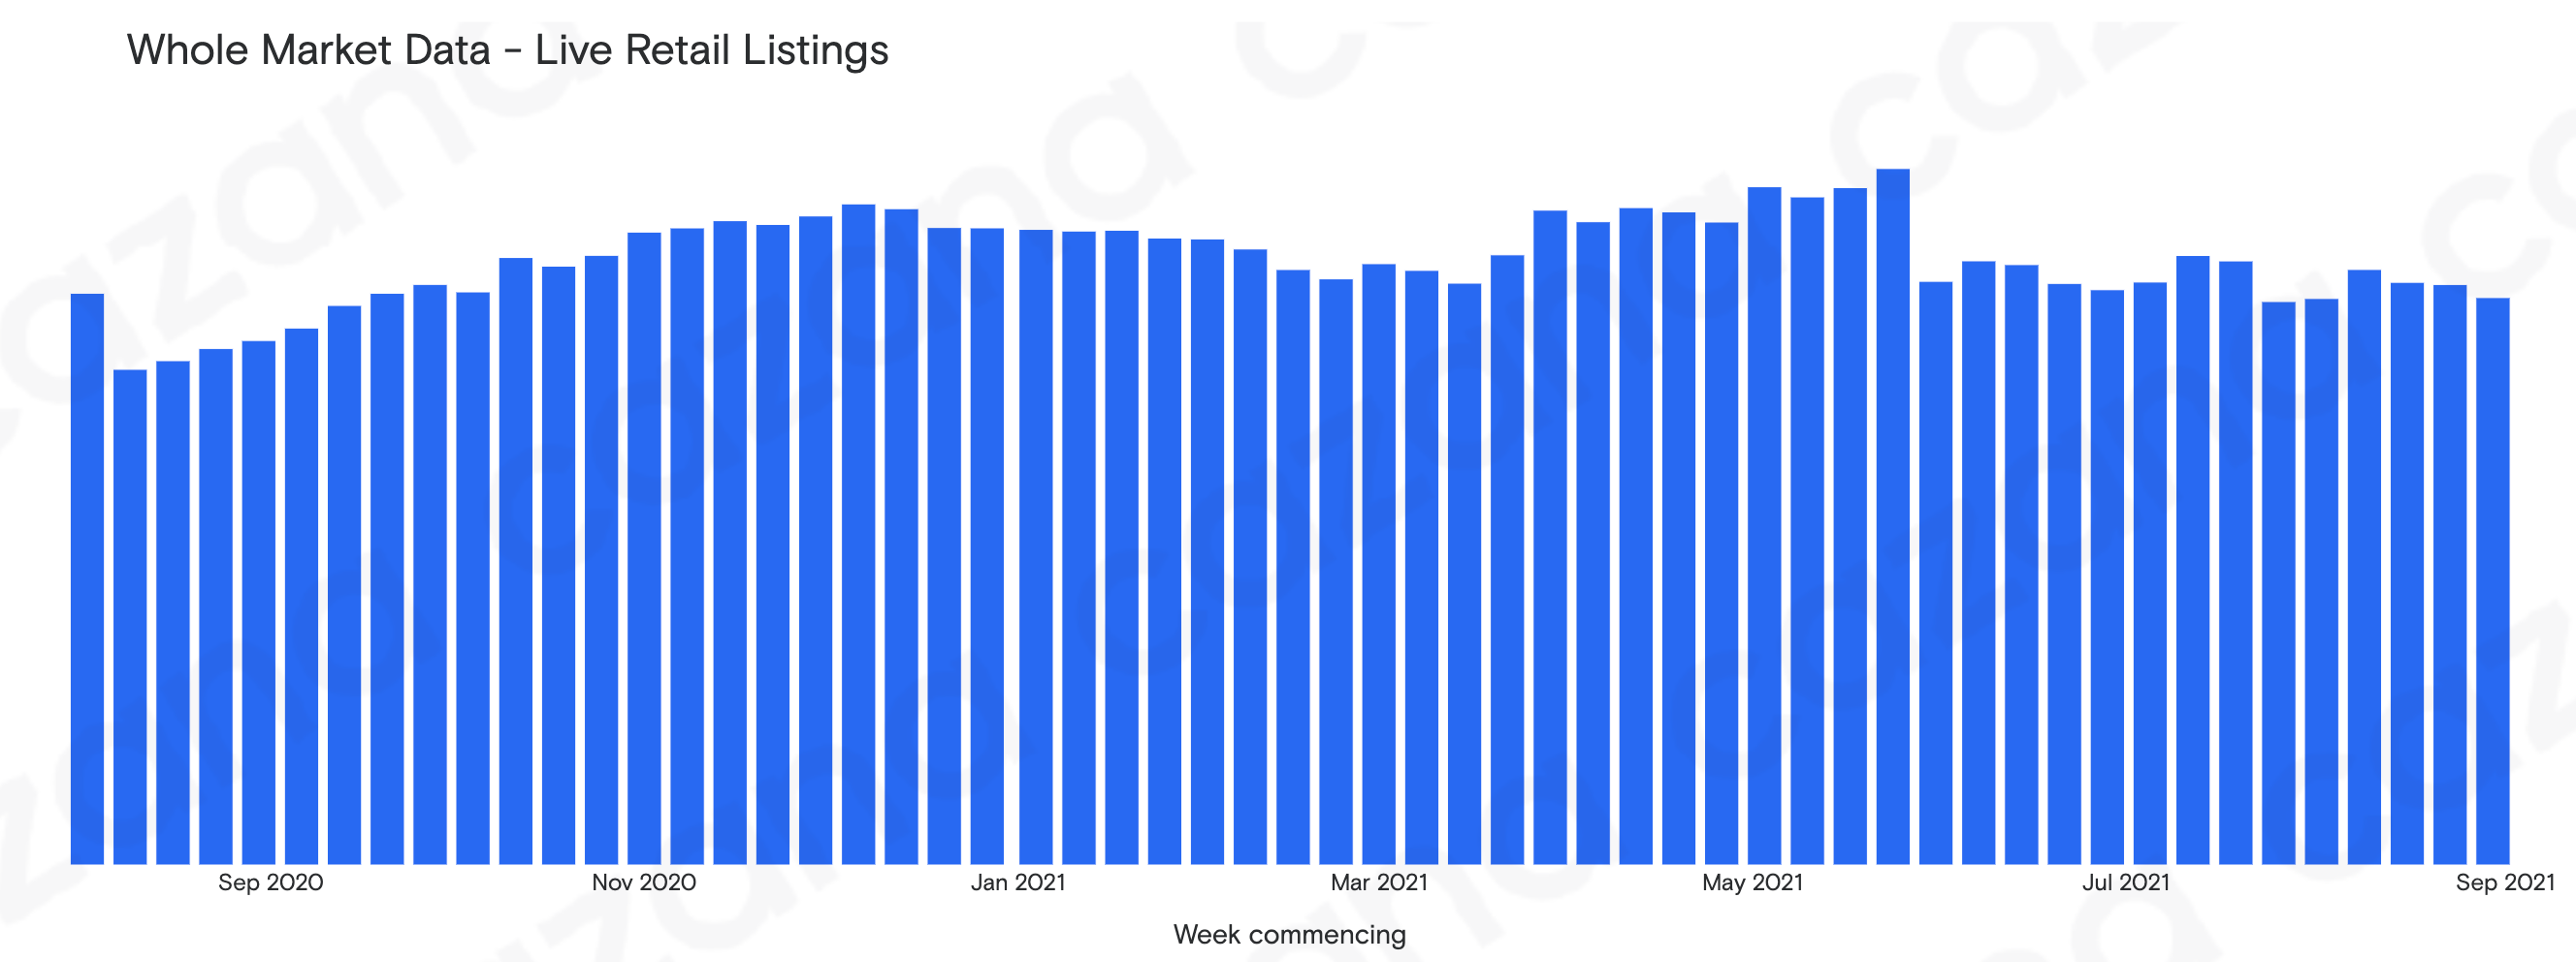
Data powered by Cazana.
What is immediately apparent is the pattern of the live retail adverts in the market and the volatility the market has seen since the peak availability of stock that was recorded in the week commencing May 24th. As the year has progressed there has been a consistent downward trend with the occasional peak here and there largely attributable to either life, sporting, or market events. The question is how much lower the volume of used car retail adverts can go over the coming months before there is a better balance of supply and demand.
However, the value of Cazana data is always in the specific detail and the chart below gives a better indication as to what has been happening to the volume of live listings in the used car market in the last week: -
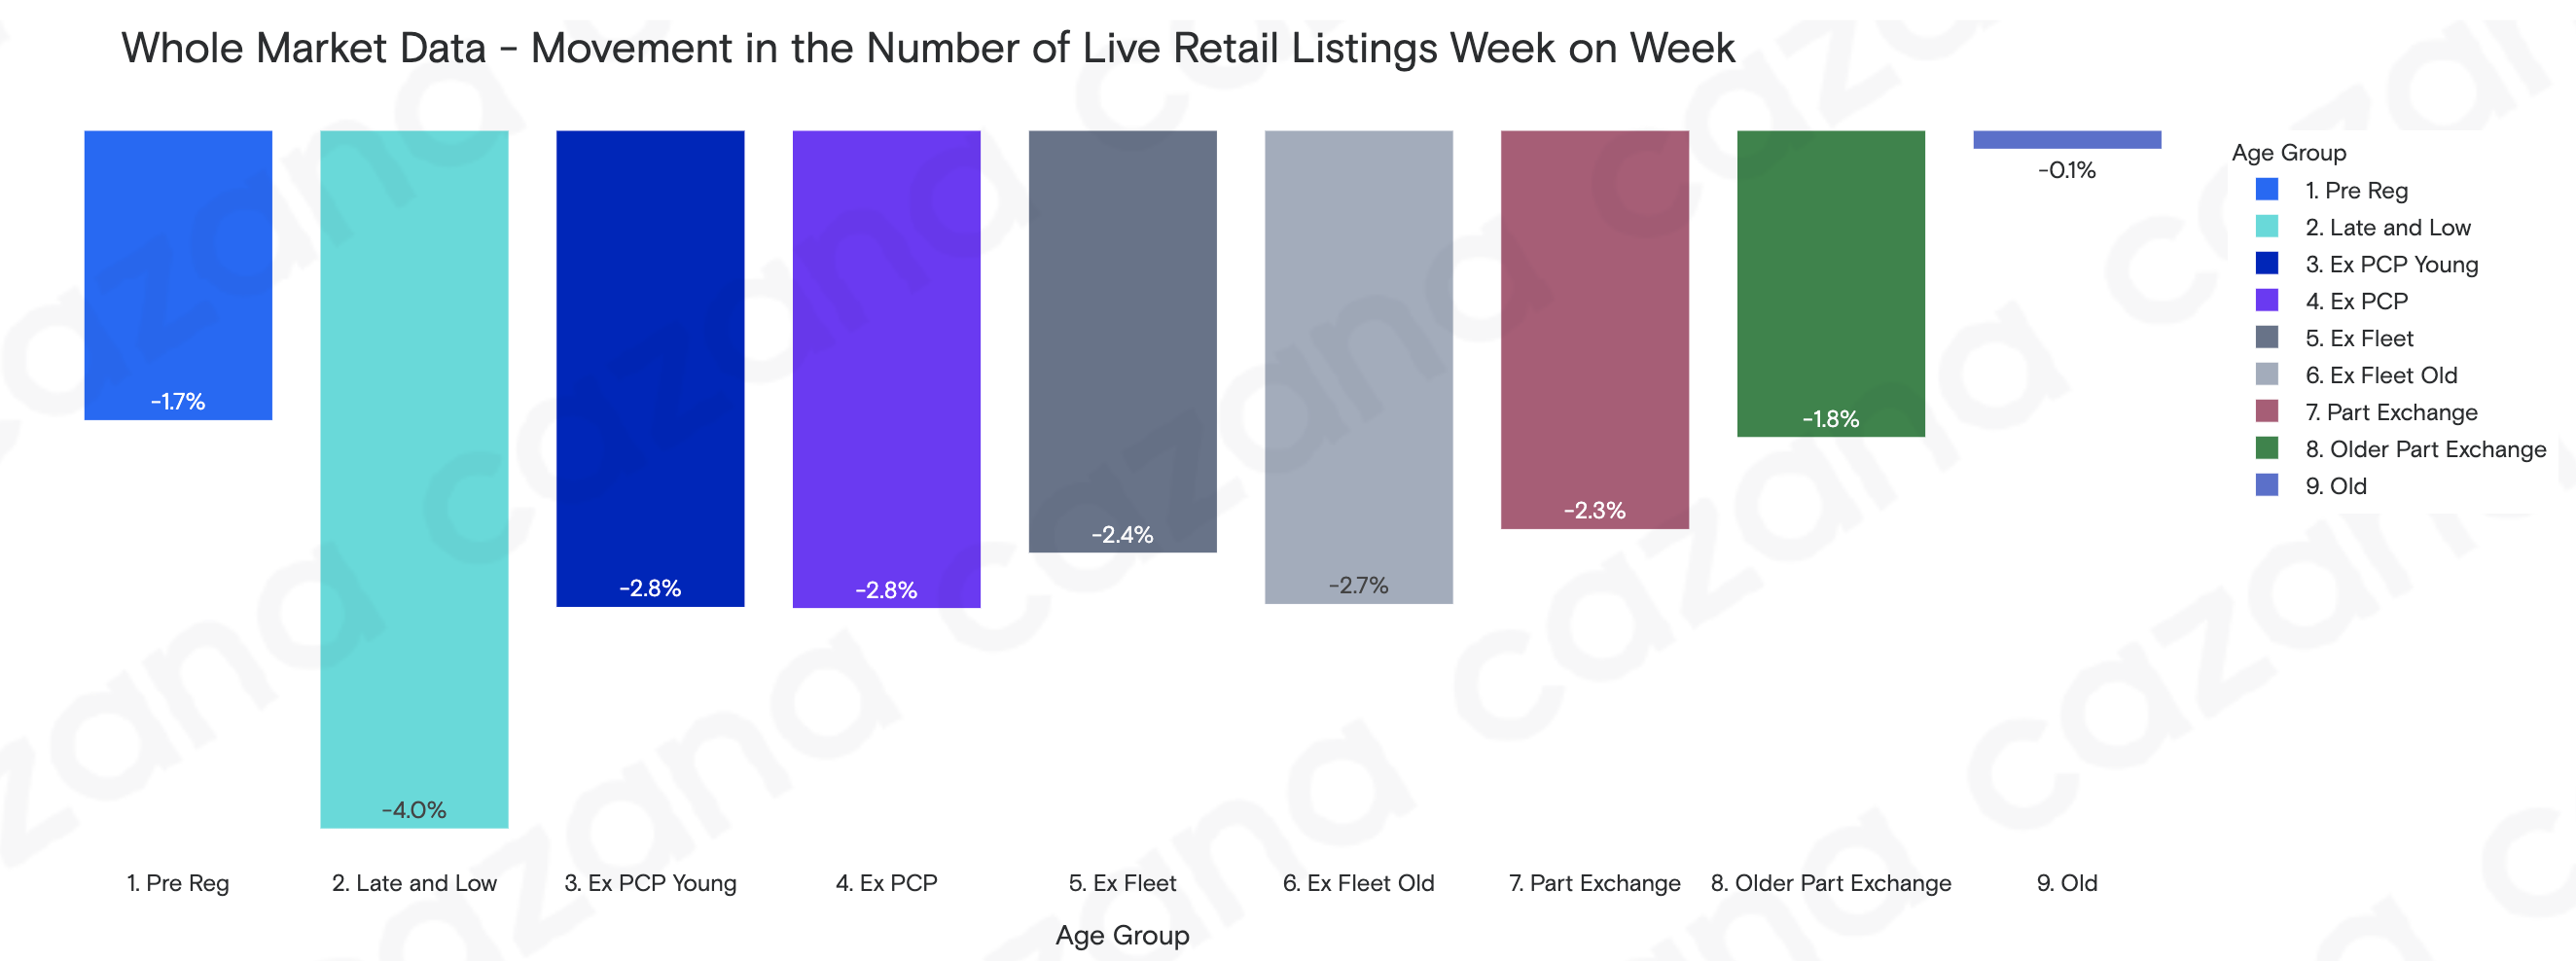
Data powered by Cazana.
The chart above looks at the change in the volume of live retail listings by age profile and gives further context to the previous chart. The whole market move was a drop of -2.3% week on week, but it is very clear that the drop in the number of live retail listings predominantly affected the newer cars and most specifically the Late and Low age profile. This profile accounts for 10% of the total market but combined with the Ex PCP age vehicles the total market representation is 37.2%. Uncharacteristically, there has been better stability for the Old Car age profile which normally shows volatile shifts from week to week. This data implies greater demand for the younger cars which is interesting, and taking the analysis to the next level to review live retail listings and sales volumes by OEM is a fascinating exercise well worth the bespoke reporting cost to open the sales and profit opportunities that a modern auto business strives to achieve.
Therefore to conclude, it is evident that new car market activity is still being hampered by the volume of new cars available for sale. This is unlikely to change in the short term and will continue to affect business volume planning and bonus expectations. From a used car perspective demand and subsequent sales volumes have dipped over the last week but this can often be the case at this time of year. However, the lack of used car stock and condition of cars in the wholesale market remains of concern and rightly so. The coming weeks will be closely watched as retailers seek to try and make budget expectations set earlier in the year before the stock issue had been acknowledged and the need for quality retail driven insight remains imperative to maximise the slightly limited new and used car sales opportunities.
