The automotive sector has been feeling the pinch for the last few weeks, and the previous 7 day period has begun to send some warning signals across the industry as the volume of sales leads continues to shrink. At the same time, sales activity is also declining further as the UK consumer appears to be a bit more focused on the benefits and freedom of coming out of lockdown. In addition, travel and holidays seem to be back on the agenda as demand for holiday accommodation in the UK reaches a significant high, at the same time pushing holiday home pricing to hitherto unseen levels for some places.
With the retail consumer distracted from cars and the weather in the last week creating a holiday vibe, used car retailers have had to work hard on retail pricing to draw interest from buyers. Daily analysis of the market position and market desirability has become even more important, as has the need to focus heavily on different trends and nuances that can present greater opportunity and better revenue. However, it is not all bad news as certain parts of the market have been bucking the trend, and therefore approaching stock profiling and pricing in a more dynamic way has invigorated staff and potential customers alike.
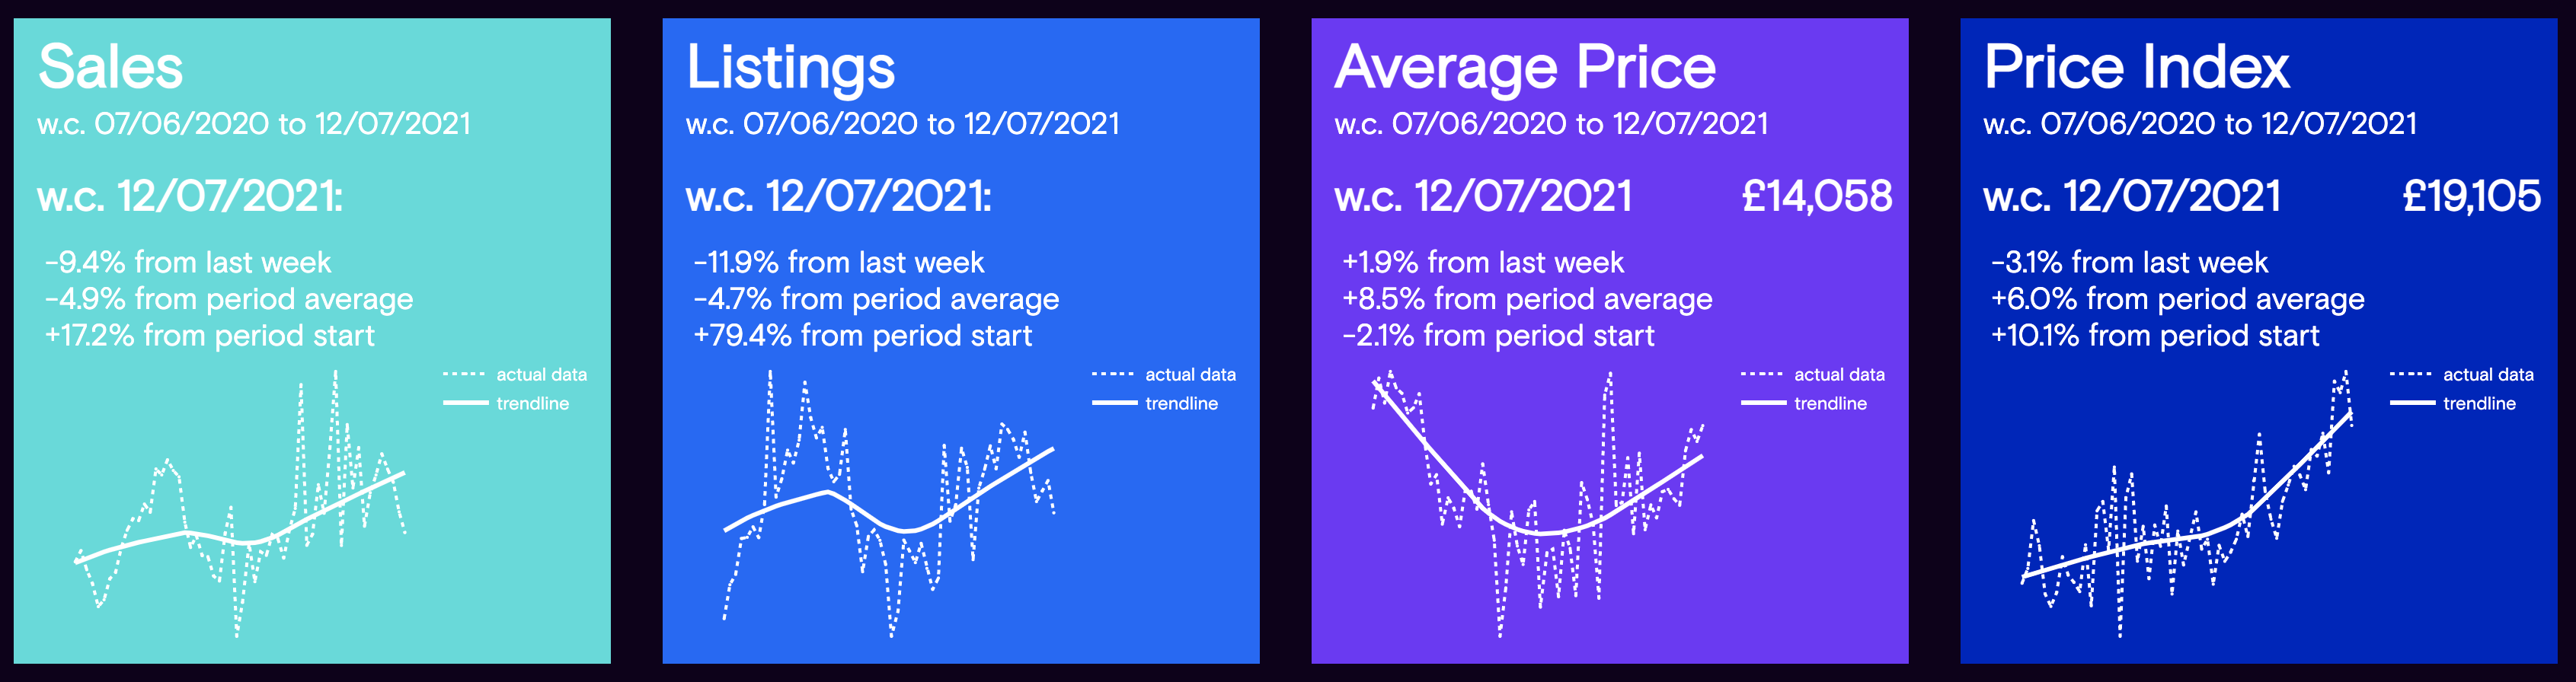
The charts below summarise and qualify the market dynamics during the week commencing July 12th compared with the previous week, and they also show the full year trend of the stated data period shown at the bottom of each panel: -
Data powered by Cazana.
The sales chart clearly shows the downward turn in sales performance over the last four weeks and the decline in the last 7 days was not insignificant at -9.4%. The Cazana data is corroborated by the insight from the DVLA statistics and after 4 weeks, this position is clearly a trend that needs to be acknowledged and monitored. The key is to dig more deeply into the data and identify which market sectors have been affected more than others. All that said the one sales positive, is that over the full year data period used car sales were up by +17.2%.
One of the contributing factors to the drop in used car sales could be the level of available stock on the retailer forecourts. The chart shows that new retail advert listings have declined by -11.9% week on week and this may have impacted sales. This is after a period of increasing numbers of new retail adverts which had suggested that perhaps used car stock availability was getting better but it seems that is not the case. When stock is short, understanding the profile of the cars on sale is key to ensure the right used car stock is sourced for the right market where possible.
From a retail pricing perspective, the Cazana Used Car Retail Price Index took a dip week on week, with a decline of -3.1% taking the normalised figure to £19,105. However, in raw terms the simple average price of a used car did increase by +1.9% to £14,508 and this is an important message from an overall market point of view. It is worth noting that for the year period, the Cazana Used Car Retail Pricing Index is up by +10.1%.
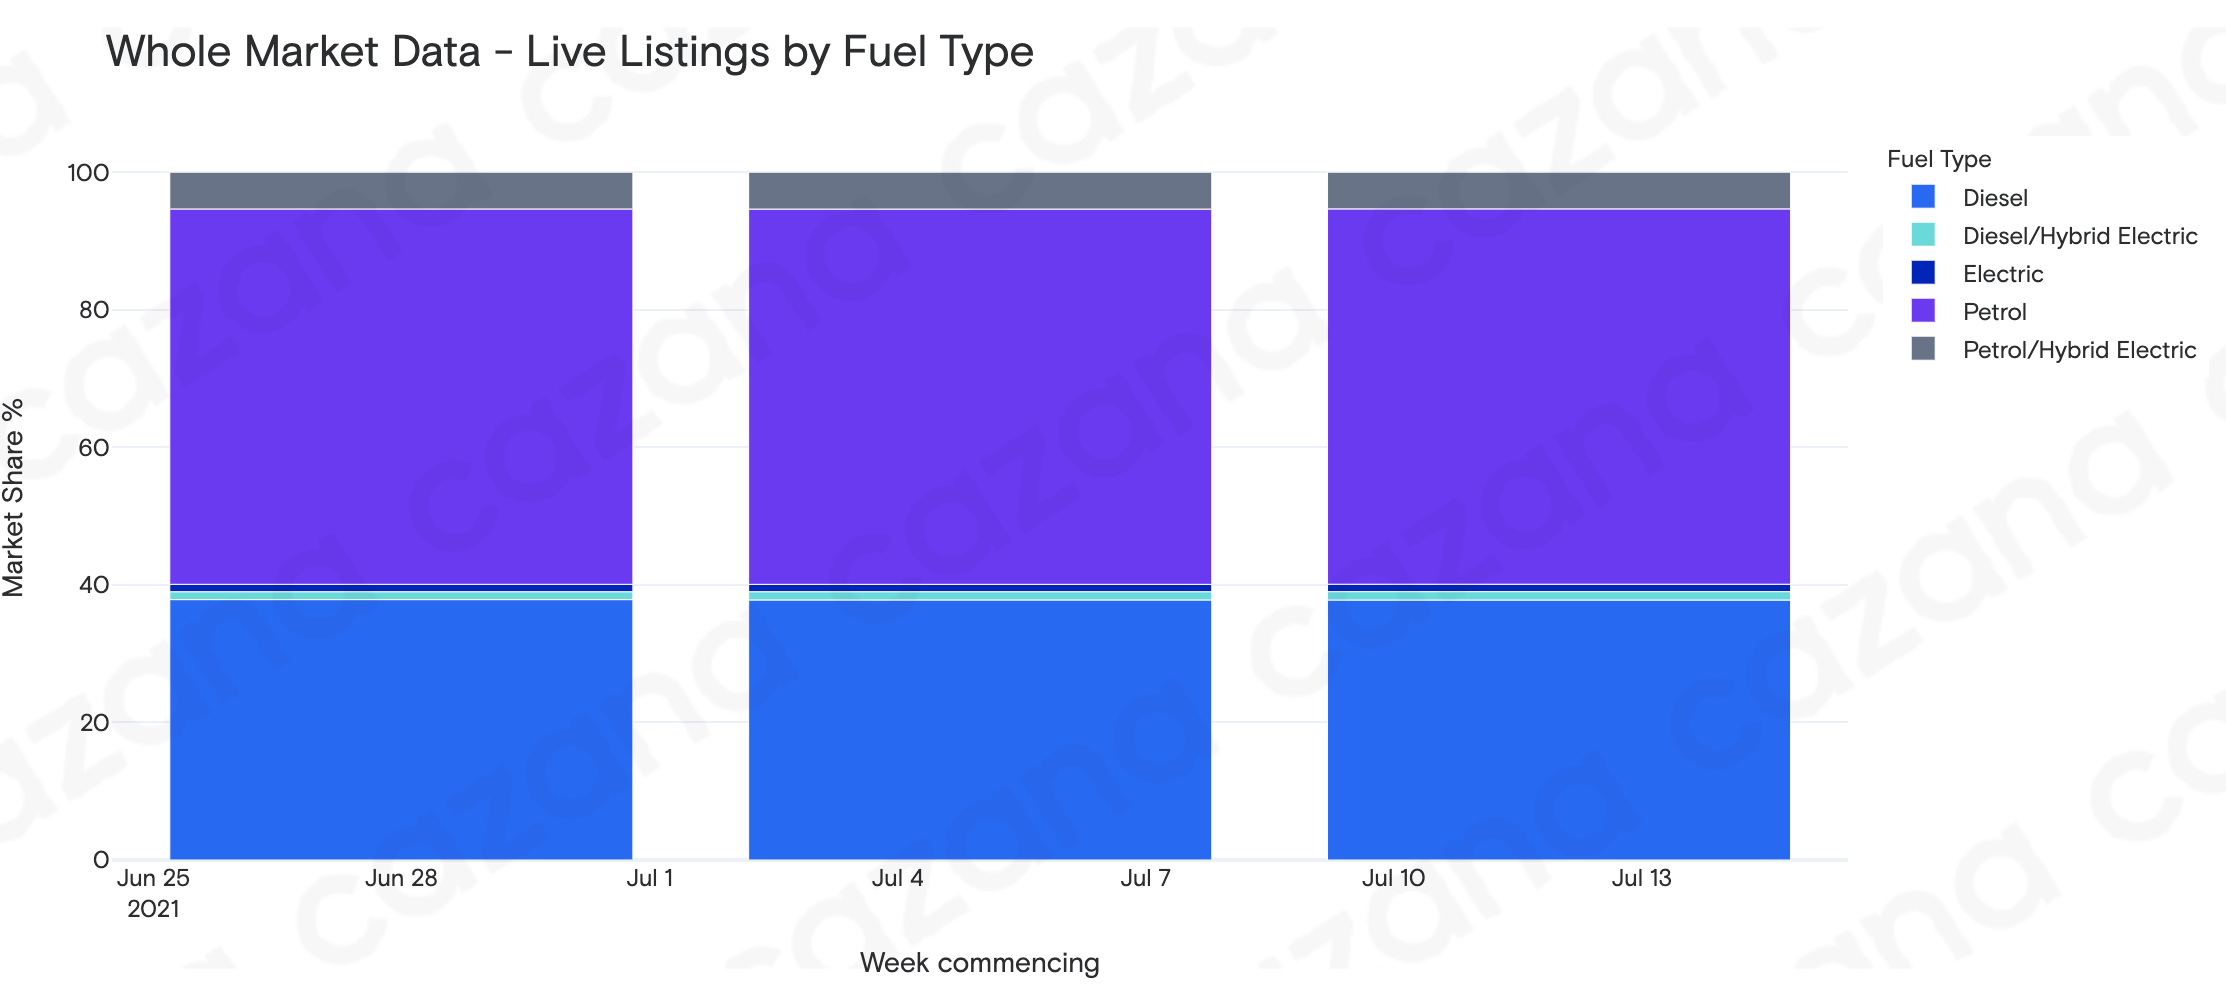
Given that the number of fresh used car listings has been dropping in recent weeks, the chart below looks at a market share view by fuel type for the live retail listings: -
Data powered by Cazana.
The data in this chart emphatically shows that from a market share percentage viewpoint, there has been no change to the proportional split of used retail cars on sale. In addition from other Cazana data, it is clear that there has been a minimal increase in the total volume of used cars on sale in the market overall since the beginning of July, with the rate of sales not keeping pace with the volume of new retail listings going to the OEM and used car retailer websites. As such, this suggests that the overall shifts are all about the whole market rather than a fuel type as shown above or as independently checked in the Cazana age profile either.
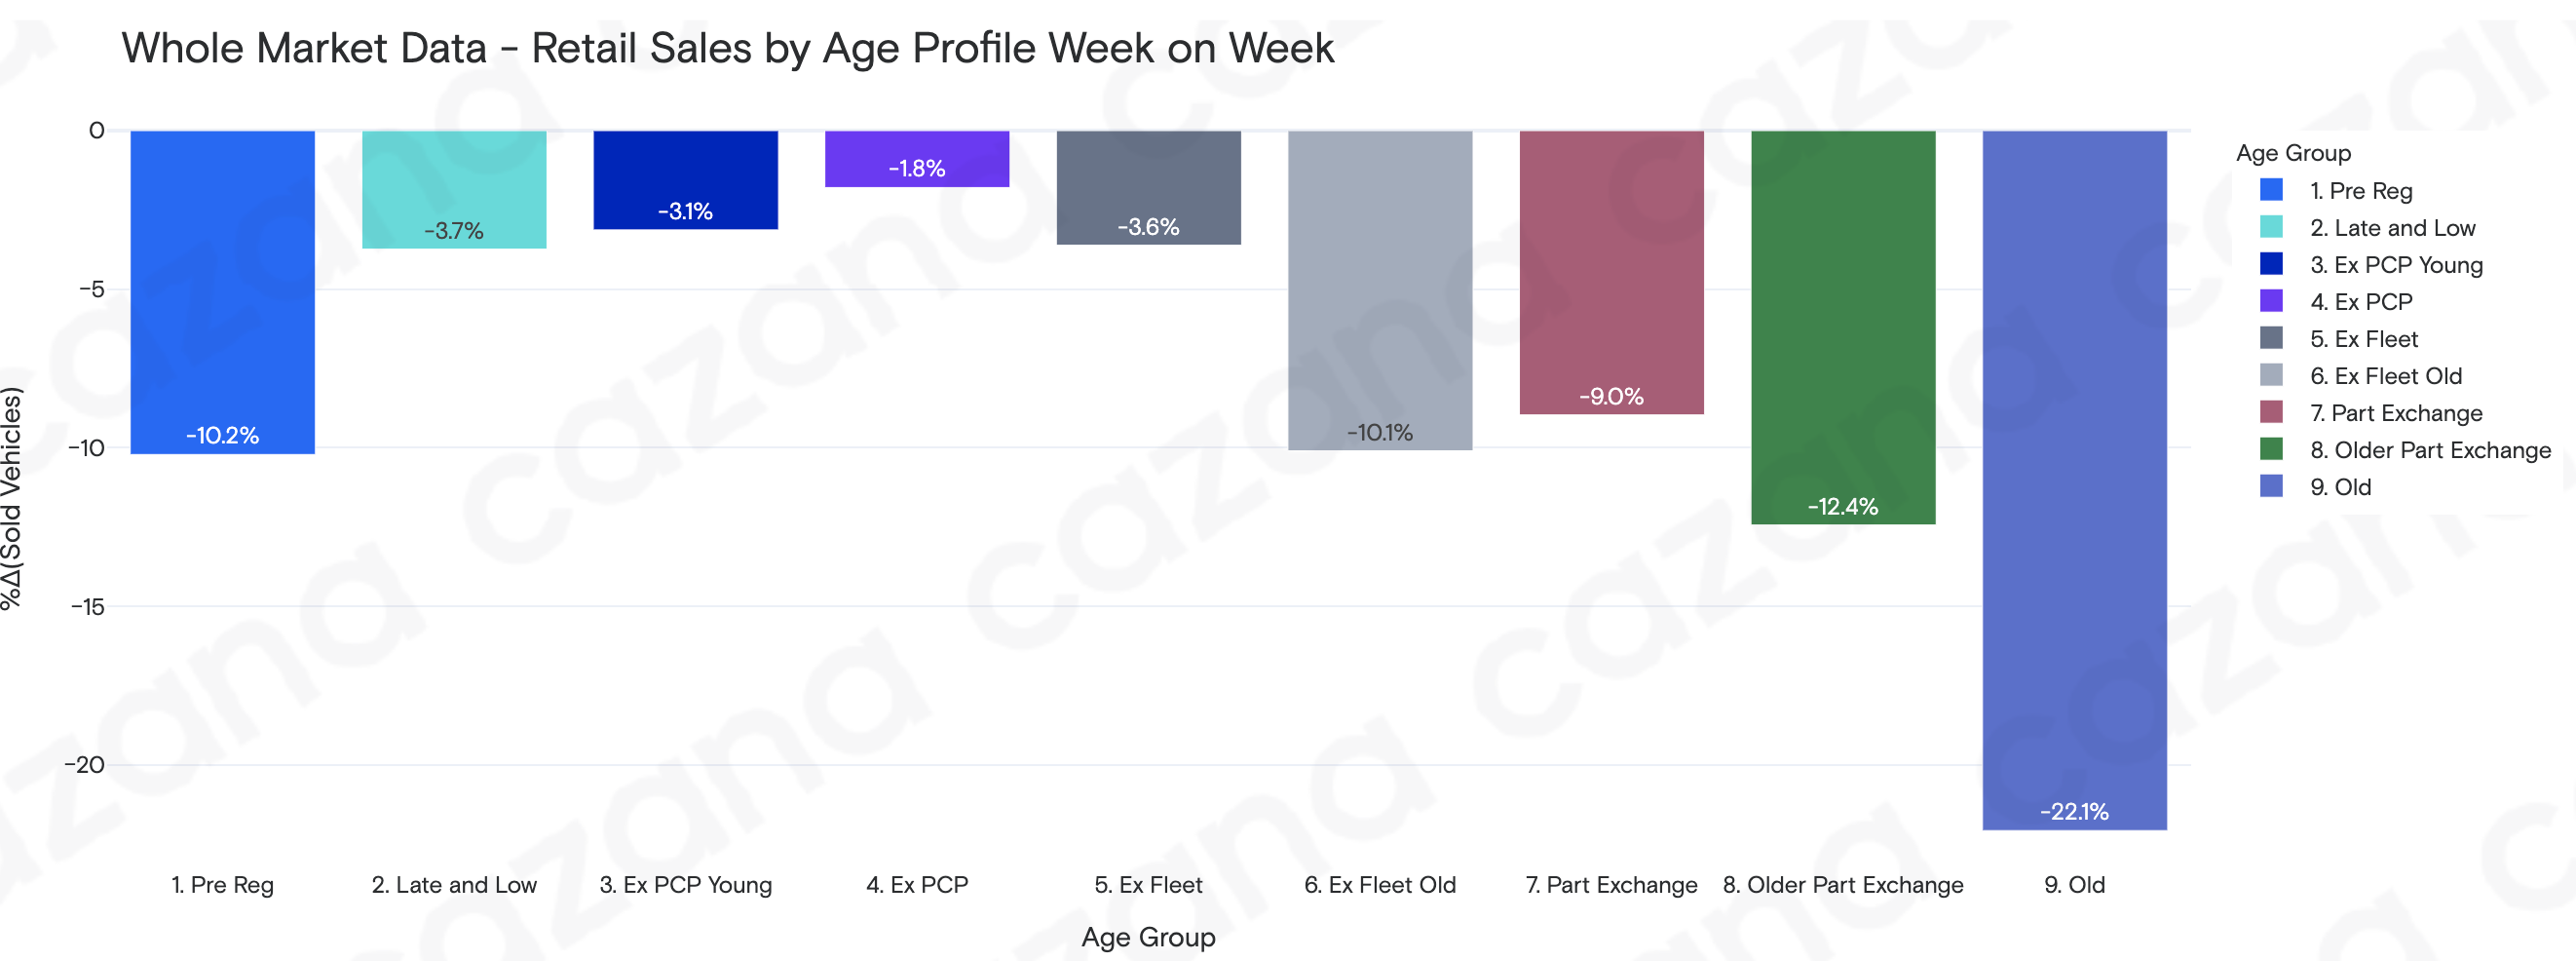
Looking at the market data with a slightly different lens, the chart below shows what has happened to retail sales week on week by looking at the age profile : -
Data powered by Cazana.
The data in the previous chart is really fascinating as it gives clarity to the overall -9.4% drop in used car sales from the previous week. It is evident that there has been a tail off in sales of cars over 5 years old, with a specific focus on old cars or vehicles over 10 years old that saw a drop of -22.1% in total used car sales week on week. It is also of note that part exchange profile cars, that experienced a drop in sales volume of -9% according to the chart, actually took the largest share of all sales for the week at 37.5% of total volume. On a positive note, it is good to see another decline in the volume of pre reg profile cars being sold which is presumably off the back of the restricted supply of new cars. This is a trend that until 2 weeks ago had not been reflected in used car sales and the wider Cazana data shows that pre reg sales accounted for just 2.1% of total sales volume for the week.
In summary, the market for both new and used cars is on a downward trend. The former due to serious new car production difficulties for certain OEMs as a result of, but not just because of, semiconductor shortages. For used cars the downward trend in sales is probably due to a combination of the weather and the mixed consumer feelings surrounding the recent “freedom day”, which enables people to live a more normal life mixing with others and travelling mostly to UK destinations for long awaited holidays. With this level of market volatility, having access to the right realtime whole market data is essential to keep margin, stockturn and commercial profitability at the best possible level.
