During the third week of trading after the retail showrooms opened, the car market seemed to be a little under pressure. Feedback of a drop in the volume of leads was noted and the subsequent week’s data results were eagerly awaited as retailers reported a slight decline in the number of showroom appointments and online reservations. It was always going to be a bit of a guess as to how long the post lockdown pent up demand was going to last, but there were certainly signs of a slight retail hesitancy during the last 7 days. This could have been because of it being the run-up week to the May Bank Holiday weekend, which can at times see retail consumers spending money on leisure pursuits and DIY projects rather than cars.
The charts below qualify the market dynamics during the previous week with the full-year trend of the data shown at the bottom in yellow: -
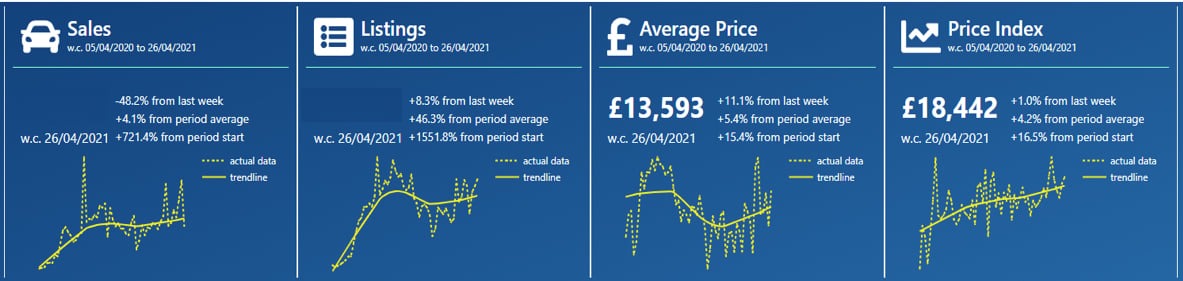
Data powered by Cazana
These charts show that the rate of sales did indeed decline in the last 7-day period when compared to the previous week with a marked drop of –48.2%. There can be reasons other than a decline in demand that may have affected the results including the fact that the first 2 weeks of frantic retailing after the car showrooms opened has left forecourts a little empty and retailers short of stock. In addition, it is worth highlighting that the 2 previous weeks recorded significant increases in the volume of cars sold and this could be the balancing period as replacement stock is delivered, prepared and advertised. It is also worth considering that sales are 28.1% higher than April 2019 so all is not lost by any means.
The charts also highlight the fact that retail adverts increased by +8.2% on the previous week which lends some credence to the possibility of the delayed arrival of replacement cars sourced by buyers in a very lively wholesale market. Remarketing companies and remarketing specialists have been in the enviable position of being able to use realtime, retail driven pricing insight which has helped them to understand the market shortages of desirable stock and to alter their wholesale pricing structure accordingly to match retailer demand and maximise the asset return value.
The Cazana Used Car Retail Price Index, which is based on normalised data, shows a further increase this week of +1%. It is also worth noting that the index shows an increase of +16.5% over the last year and this highlights the health of the used car market despite COVID 19 and the three lockdown periods in the last year.
Given that there has been a significant drop in the number of retail sales it is imperative to understand why this might have happened and to look to see whether there is any key performance indicator that has significantly altered or been affected by current market conditions or any other sort of dynamic from the wider economy. As such the chart below looks at retail sales by Age Profile: -
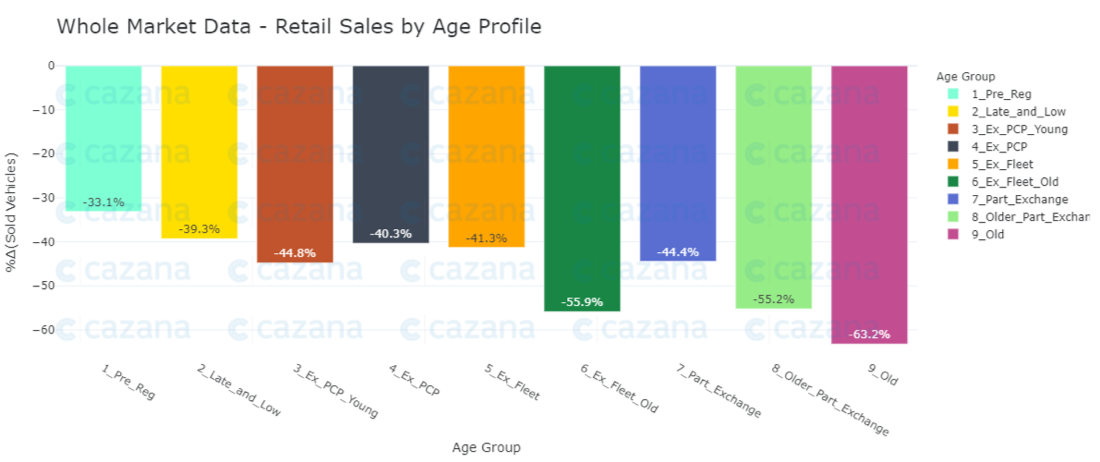 Data powered by Cazana
Different lenses on the market data can often reveal nuances that both retailers and remarketers need to be aware of and this chart shows that the Old Car profile has seen the largest decline in retail sales week on week. With a -63.2% decline, this is interesting as it may highlight difficulties in finding and or preparing this age stock for retail sale. It is also of note that the lightest drop in sales came from the Pre Reg sector. This could signify that there are less Pre Reg cars in the market and this could be a direct result of supply restrictions driven by the lack of new product available due to the semi conductor shortage.
The age profile with the largest share of retail sales in the market in the last week was the Part Exchange profile which recorded 33.3% of the total share of sales. In comparison, the Pre Reg profile recorded just 1.1% of the total share of sales and the Old Car profile 14.7%. It is always important to put some context around the headline results and equally important to push for more detail around core stock.
With this in mind, the chart below looks a little further into the market performance by looking at what happened with retail sales week on week by market sector: -
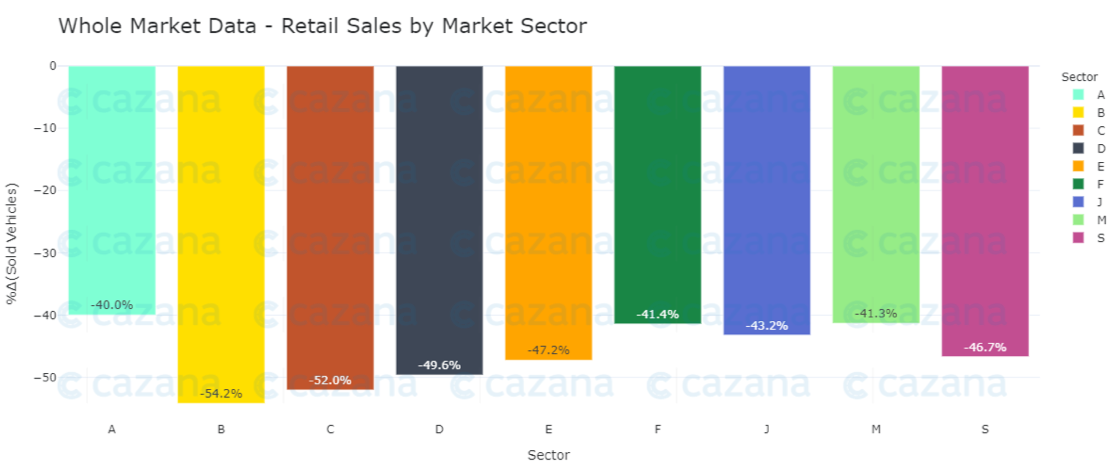
Data powered by Cazana
The previous chart showcases another view of used car activity in the retail market, and this shows that by sector it was B or Small Cars that suffered the largest drop in sales with a dip of -54.2% on the previous week. This tied with the previous data that demonstrated that Old Cars saw the largest drop in retail sales suggests that either B Sector small cars are in short supply, which would require a little more analysis, or that the demand for these cars really has dropped. This has been an industry discussion point of late as anecdotal evidence has suggested that buyers of this type of car as a second or third car for travelling to and from work, have now been satisfied and therefore there is less demand.
Therefore, to summarise, the car market last week appears to have hit a slow period, and this could be for many different reasons. There is certainly no need for panic as used car sales remain at strong levels in comparison and the new car position will be clarified by the SMMT later this week. What this market has highlighted is the need for dynamic retail driven data that only Cazana can provide. Customers have been able to make the most of retail and wholesale opportunities by understanding what is selling and how quickly using realtime data giving that commercial competitive edge and supporting a profitable used car and disposal strategy.
