The month of January is a receding memory, and last week gave the first sign of how the February used car market will perform. Retailers have had to contend with poor weather and the promise of more disruption to come as temperatures plunge. In some respects, the adverse conditions have highlighted the advantages of the “mouse to house” sales journey, and online vehicle viewings have received a further boost to their popularity and cemented the need for them in every retailer’s online sale process.
The charts below qualify the market performance over the last week with a full year trendline shown in yellow: –
.png?width=1177&name=Cazana-weekly-price-watch-chart%20(1).png)
Data powered by Cazana
Sales may have dipped a little further this week showing as being -9.3% lower than the previous week, although it is fair to say that February is not a wonderfully busy month in the best of times. New retail advert listings are reasonably consistent, although slightly down, and this might well be reflecting the slight difficulty some dealers are having finding replacement stock. Good quality cars are hard to find at the moment and buying cars for stock that need work, often results in delays in the preparation process.
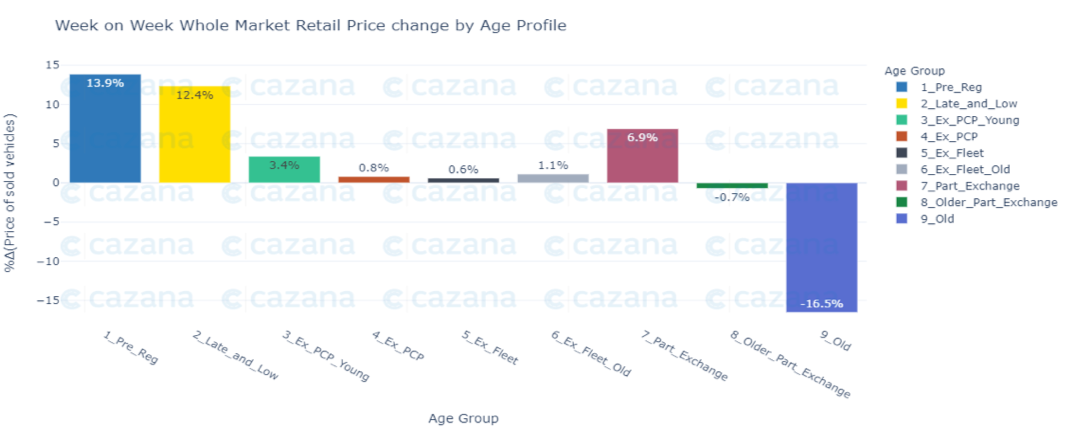
The chart below looks at retail price movements week on week by age profile: –
Data powered by Cazana
This chart above is very interesting and highlights the importance of using realtime data as part of a pricing and insight strategy. The market last week showed some significant changes even though the headline Cazana RPI showed a drop of -2.1% on the previous week. This headline hid a big change in the younger end of the market and also the Older Car age profile that showed an astonshing 16.5% drop in retail pricing. The volatility in the old car market is fascinating and as a direct comparison to the previous week, it is also noteworthy to see a far more balanced view of pricing for cars over 6.5 years in age overall.
Given the volatility of this age of vehicle the chart below looks at total sales by fuel type over the past 6 months: –

Data powered by Cazana
This chart reflects upon the sales and fuel split in the last 6 months. At first sight one might think that these figures depict a normal market sales pattern although activity in September higher than normal. This is perhaps a reflection of the introduction of localised Lockdowns and the impending arrival of the colder wetter months influencing the retail consumer demand for Old Cars to keep people away from public transport and the risk of COVID. Of other note is the significant overall jump in sales of Old cars in January 2021. This seems particularly high although the current circumstances and lockdown will have influenced this quite heavily.
In summary, the used car market appears less healthy than the previous week based on the headline figures. These must be balanced against the time of year and a traditionally quiet month of trading is often the achilles heel for February. The data shows that retail pricing is still moving and the reality is that there are some very volatile market sectors in which profit and loss will have hurt some and benefitted others. Use Cazana realtime market data, as it is essential to help maximise the current level of sales opportunities in the UK used car market.
