The last seven days have seen a shift in retail consumer demand as the volume of sales enquiries for many dealers remained consistent but the appetite to commit to buying dropped leaving sales teams working harder to get the deals. This change in the market has been described by some as perplexing although there is an anecdotal comment that consumers are perhaps waiting for the reopening of the car showrooms on April 12th rather than use online sales options. This is a possibility although unlikely, and clearly, a poor decision by the consumer if true. The historical data points to pent up demand and stock shortages in the weeks following the reopening of showrooms which is likely to increase retail pricing. The drop-in sales conversions could be a result of the fact that there is evidence that dealers have put more staff on furlough for the final few weeks of lockdown in a bid to save costs, which means there are fewer professionals in place to close the deals.
The charts below qualify the market performance over the last 7 days in comparison to the previous week with a full year trendline shown at the bottom in yellow: –

Data powered by Cazana
Unlike retail sales for the 2 weeks prior, it is clear that the used car market had a poor period last week, and it will be very interesting to watch sales performance in the run up to April 12th. Used car listings increased significantly in the last 7 days and as such it may be that with an improvement in listings there will be a resulting upturn in sales. With growing listing volumes has come a 7.7% uplift in the average retail price of a used car and in terms of the Cazana Used Car Price Index this translates to an upturn of 2.8% over the previous week and a considerable 10.1% since the beginning of February 2020.
The chart below looks at retail price movements week on week by market sector: –

Data powered by Cazana
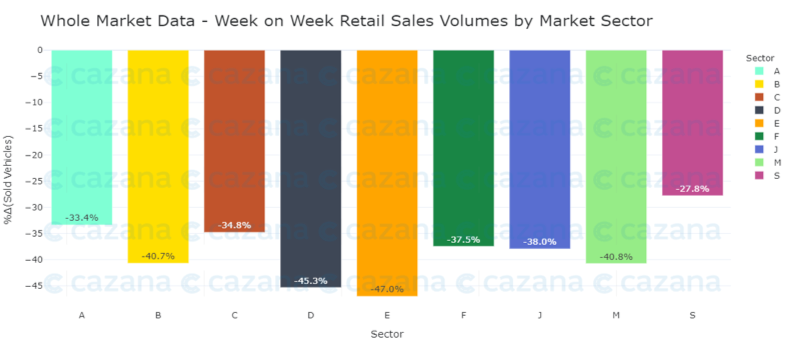
The chart above looks at how sales have changed on a market sector basis in a bid to identify any specific areas of weakness. However, this data confirms that the drop in sales has been pretty similar across the market as a whole and this perhaps supports the suggestion that there are fewer sales staff to service the incoming sales leads. The largest drops have affected the Large Car and Executive car sectors which may also give an indication of the type of customer in the market, although reviewing the data in more detail will give a transparent view of where the sales opportunities are on a day by day basis.
Looking at the market with a different lens puts a slightly alternative perspective on what may have happened in the previous 7 days: –

Data powered by Cazana
This chart also shows a reasonably good level of consistency to what has happened with used retail sales. However, in line with new car registration data sales of used diesel cars have declined by -41% some 4.6 percentage points greater than used petrol cars. In addition, it is interesting to note that the volume of used Electric cars sold dropped by the lowest amount at -29.5%. When looking at market share of total sales this meant that the shift resulted in Electric Powered cars improving market share by 13.8% which is a good step in the right direction albeit for just this one week.
To summarise, the used car market has not performed as well as many would have liked it to and there is concern over the retail consumer desire to commit to buy. The reality is that this may have been engineered by retailers furloughing sales staff in a last bid to save money before the reopening of showrooms. It is also important to note that this was the first week of March and just might highlight an increase in focus and demand for new cars. More granular examination of the data would give greater transparency and at the same time highlight commercial opportunities and threats.