The previous week saw a subtle change in the new and used car sectors with a wider acknowledgement that sales enquiries have been dropping for the past couple of weeks. In addition, footfall at the retail showrooms has also slowed slightly making life more difficult for the sales teams and at the same time, enhancing the need to understand what the right retail price is for a used car to attract a customer to either place a deposit and purchase online or visit the showrooms.
This comes at a time when the improving retail pricing movements had really begun to show in the marketplace, although at the same time used car sales volumes had been somewhat variable. The previous increases in consumer demand resulted in some quite astonishing wholesale pricing gains as retailers fought to find good quality desirable stock to fill the spaces on the forecourts, although exaggerated pricing may have been on a more limited number of cars than at first reported. Cazana mentioned this some weeks ago, and this point was reiterated by one of the leading auction companies in the last few days. This slight lull in what had been an almost frantic consumer push for used cars may give the supply chain a chance to catch up and used car stock levels to recover slightly, which would not necessarily be a bad thing for either the hard worked retailers or the consumer who would benefit from a slightly wider choice of used cars.
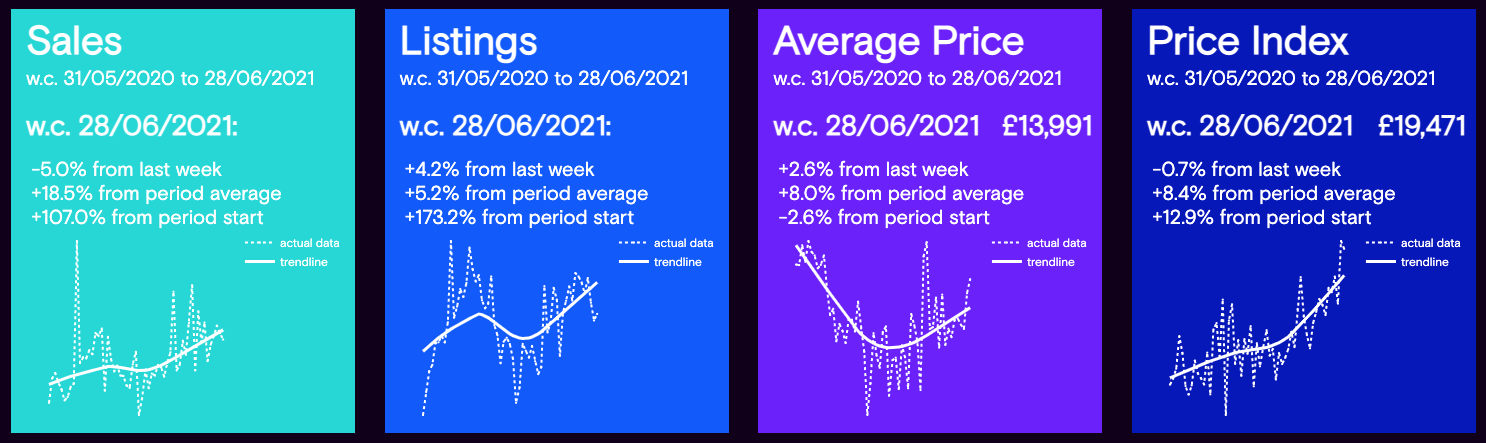
With a potentially sensitive position on the cards, the charts below qualify the market dynamics during the previous week with the full year trend of the data shown at the bottom of each panel: -
Data powered by Cazana.
This data is of great interest and confirms the marginal change in market shape with the volume of used car sales dropping by -5% in the week commencing June 28th. It is of note that the drop in used car sales comes off the back of 2 previous weeks of sales reductions and this is now almost at the point of becoming a trend. New retail advert listings increased by +4.2% from the previous week and this is the first time this has happened since the week commencing June 7th and although not a big jump, it is still an important market indicator. This type of insight needs further investigation to highlight what type of cars are coming to the market thus enabling commercial opportunity.
From a pricing perspective, the Cazana Used Car Retail Price Index declined slightly by -0.7% after a boost the previous week that clearly reflected the increased retail pricing experienced in the weeks previously. The raw Average Price for a Used Car in the market last week was £13,991 and this had increased by +2.6% from the previous week. As such, there is no evidence to suggest that there is a pricing issue in the market at the moment. However, with sales levels declining for the past three weeks it may be prudent to take extra care in the wholesale market to avoid risk on certain vehicles.
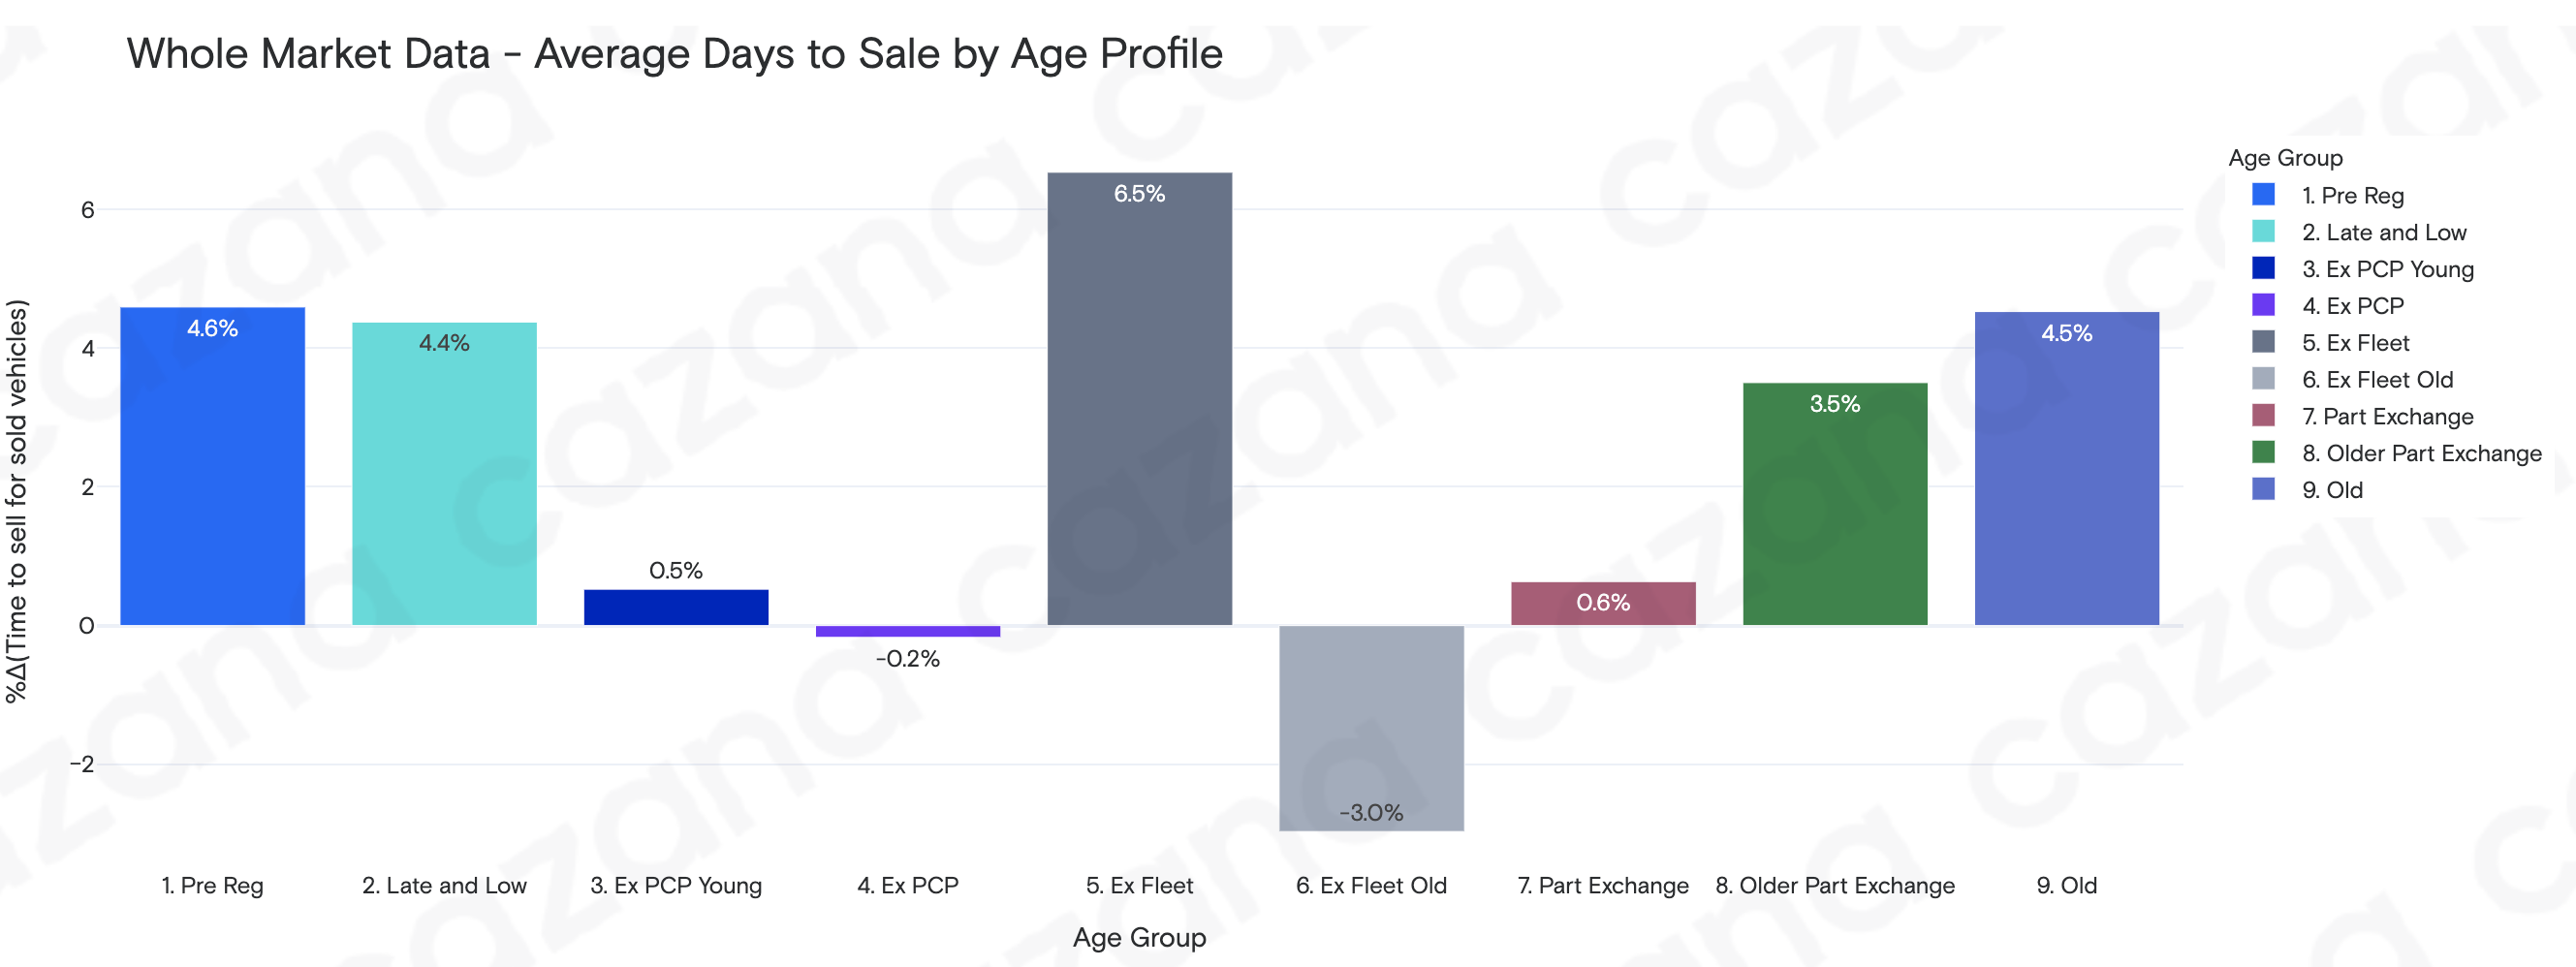
With a slight question mark over the sales volumes, the chart below looks at the market from a different perspective and shows the change in the Average Days to Sale by Age Profile over the past week: -
Data powered by Cazana.
From this chart, we can see the context behind an overall increase of +2% in the days to sale week on week lifting the figure to 33.4 days. The key increases have been for the newer and the older car segments as these sectors cover a greater proportion of the market. The increase of +6.5% for Ex Fleet cars is of less interest given the number of vehicles of this type on sale at the moment, but the trend to be taken from this chart is that cars between the age of 2 and 7.5 years are selling at the same rate.
As a side point, it is fascinating to see that Pre Reg cars have shown a drop in days to sale where there are, in theory, far less of them in the market and a strong retail consumer demand. This is worthy of greater exploration by individual OEMs to understand what is really happening, as the shortage of new car product is not necessarily as straightforward as it would seem.
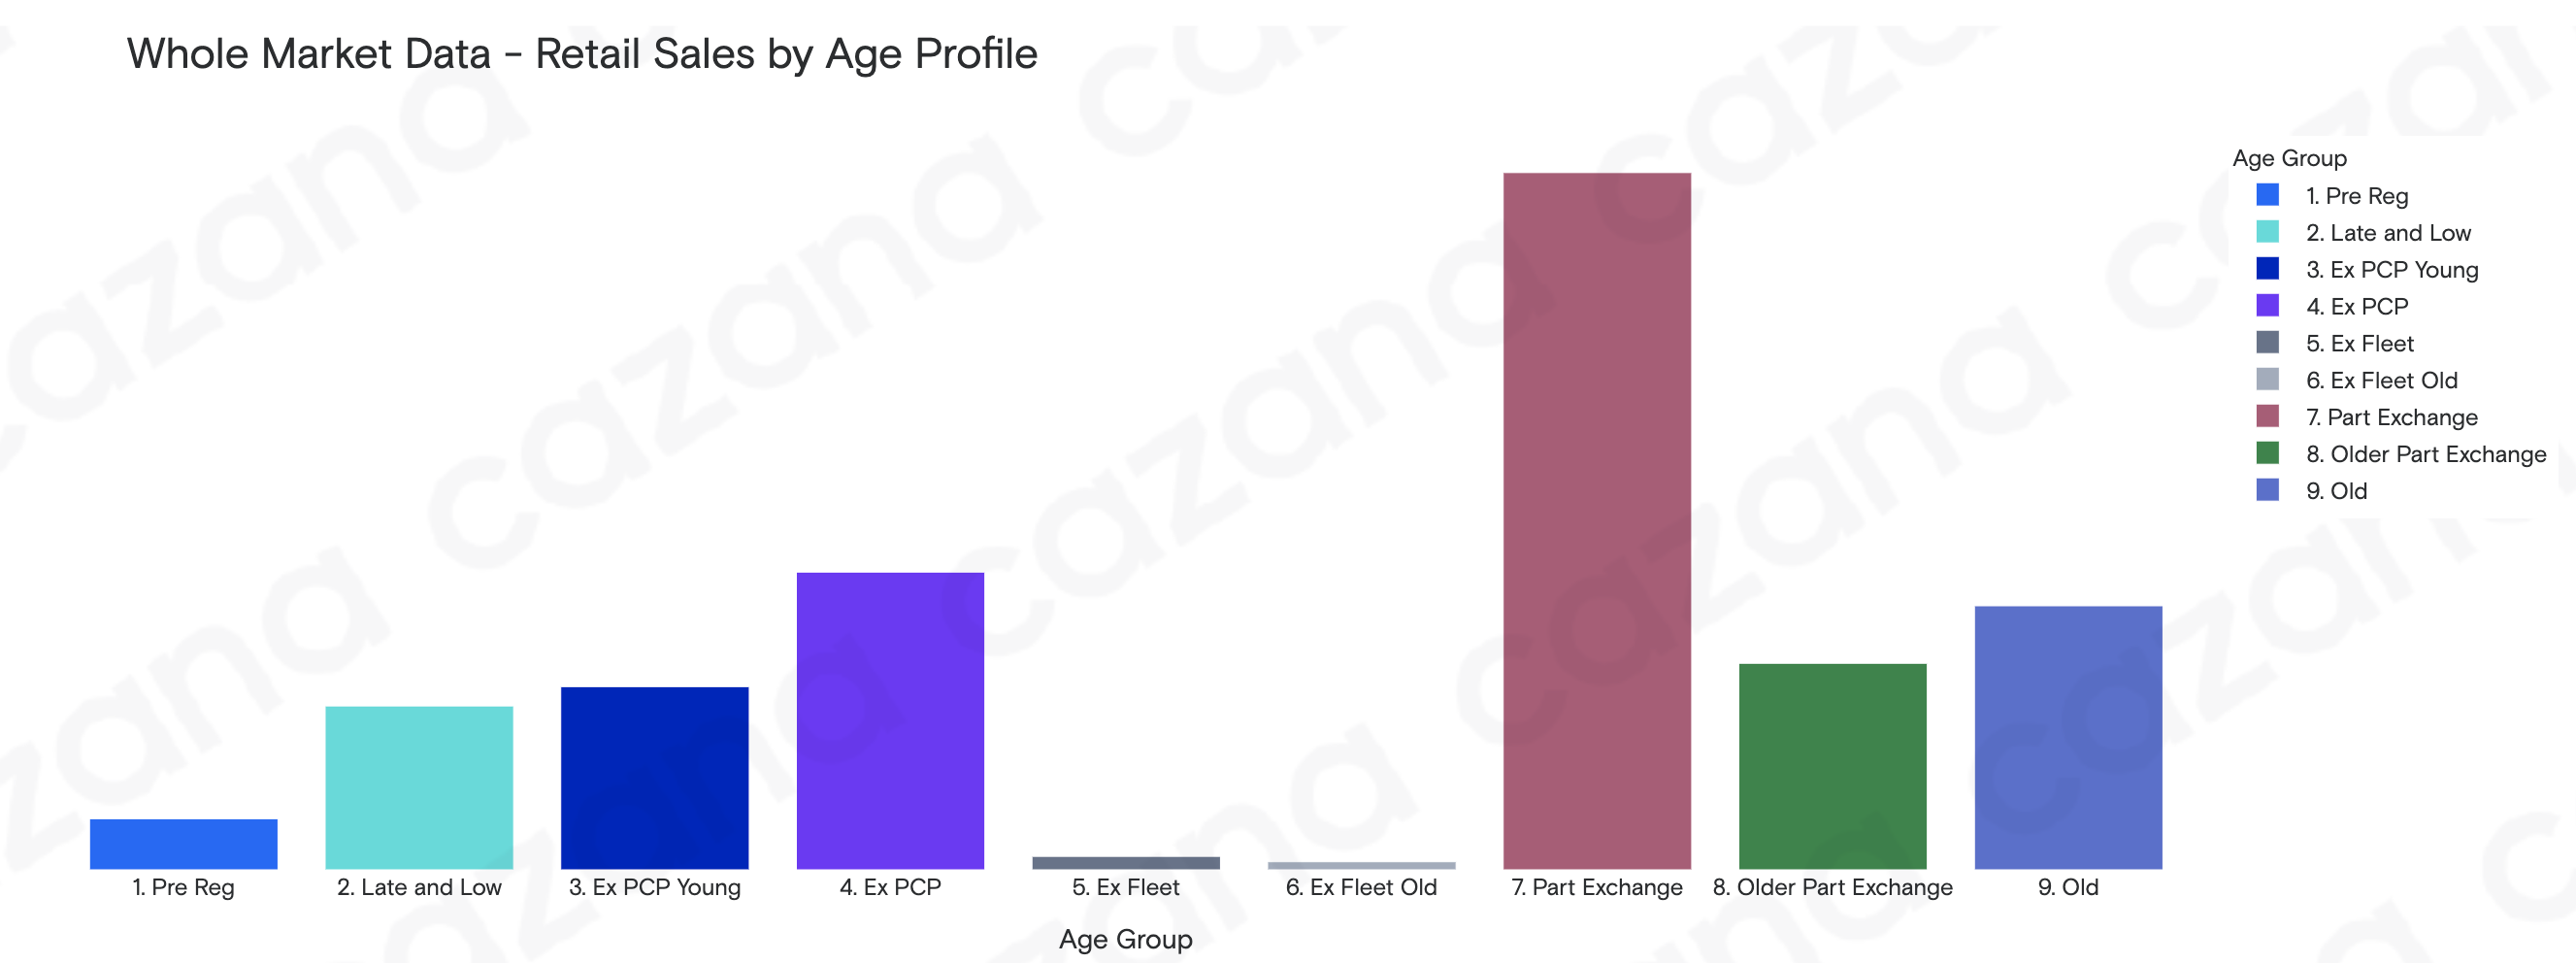
To give greater transparency to the market position, the chart below gives an indication of the split of used car sales by market sector: -
Data powered by Cazana.
This chart shows that from a sales perspective, the majority of cars were sold in the Part Exchange age profile and this ties nicely with the fact that there was a minimal increase in days to sale. This is closely followed by sales in the Ex PCP sector, and once again the increase in days to sale in the previous chart is extremely small. However, this chart shows that there was a significant volume of sales in the Old Car age profile and this sector saw an increase in days to sale of +4.5% to 32.7days. This is another example of the very varied KPI data that comes from this somewhat volatile age profile.
In summary, the market during the previous week has been more challenging than of late and it is wise to accept that currently vehicle sales appear to be on a bit of a downward trend. The same cannot be said of retail pricing which remains stable with no sign of abating yet, despite the fact that the number of new retail advert listings has climbed and may begin to redress the balance of used car stock in the market in the coming weeks. However, this is not a message of bad news in any way and could yet prove to be an anomaly in the market. It is prudent to note that this market behaviour can happen during major sporting events and England has made fine progress in the Euros to date. In previous circumstances, there has usually been a bit of a boost to car sales after the sporting event ends, bringing the market back in line and so the coming weeks will be of great interest.
