In the last week, activity in the used car market has been better than expected and it is important to acknowledge that it is the second week running that has seen improved consumer activity after a run of 4 weeks of declining sales. From a new car perspective, the industry continues to learn how bad the supply of new cars is going to be over the coming months and the likely impact that will have on retailer performance and financial budgets, not to mention the wider impact on the used car market over the next couple of months.
The question is what has moved the needle over the past couple of weeks and made a difference to consumers in a period that is quite often subdued due to summer holidays and family leisure events. There has certainly been an increase in digital sales leads which has been supported by what is at best described as a consistent level of footfall at retailer showrooms. In addition, the consumer confidence levels have also improved slightly and this is also no doubt a blow to the sector. It would seem that the sales teams have been working hard to convert sales to leads although anecdotally the feedback would suggest that those consumers that come on site are not just window shopping but actually keen to buy which is encouraging news, and there are expectations that this position will remain steady for the coming weeks.
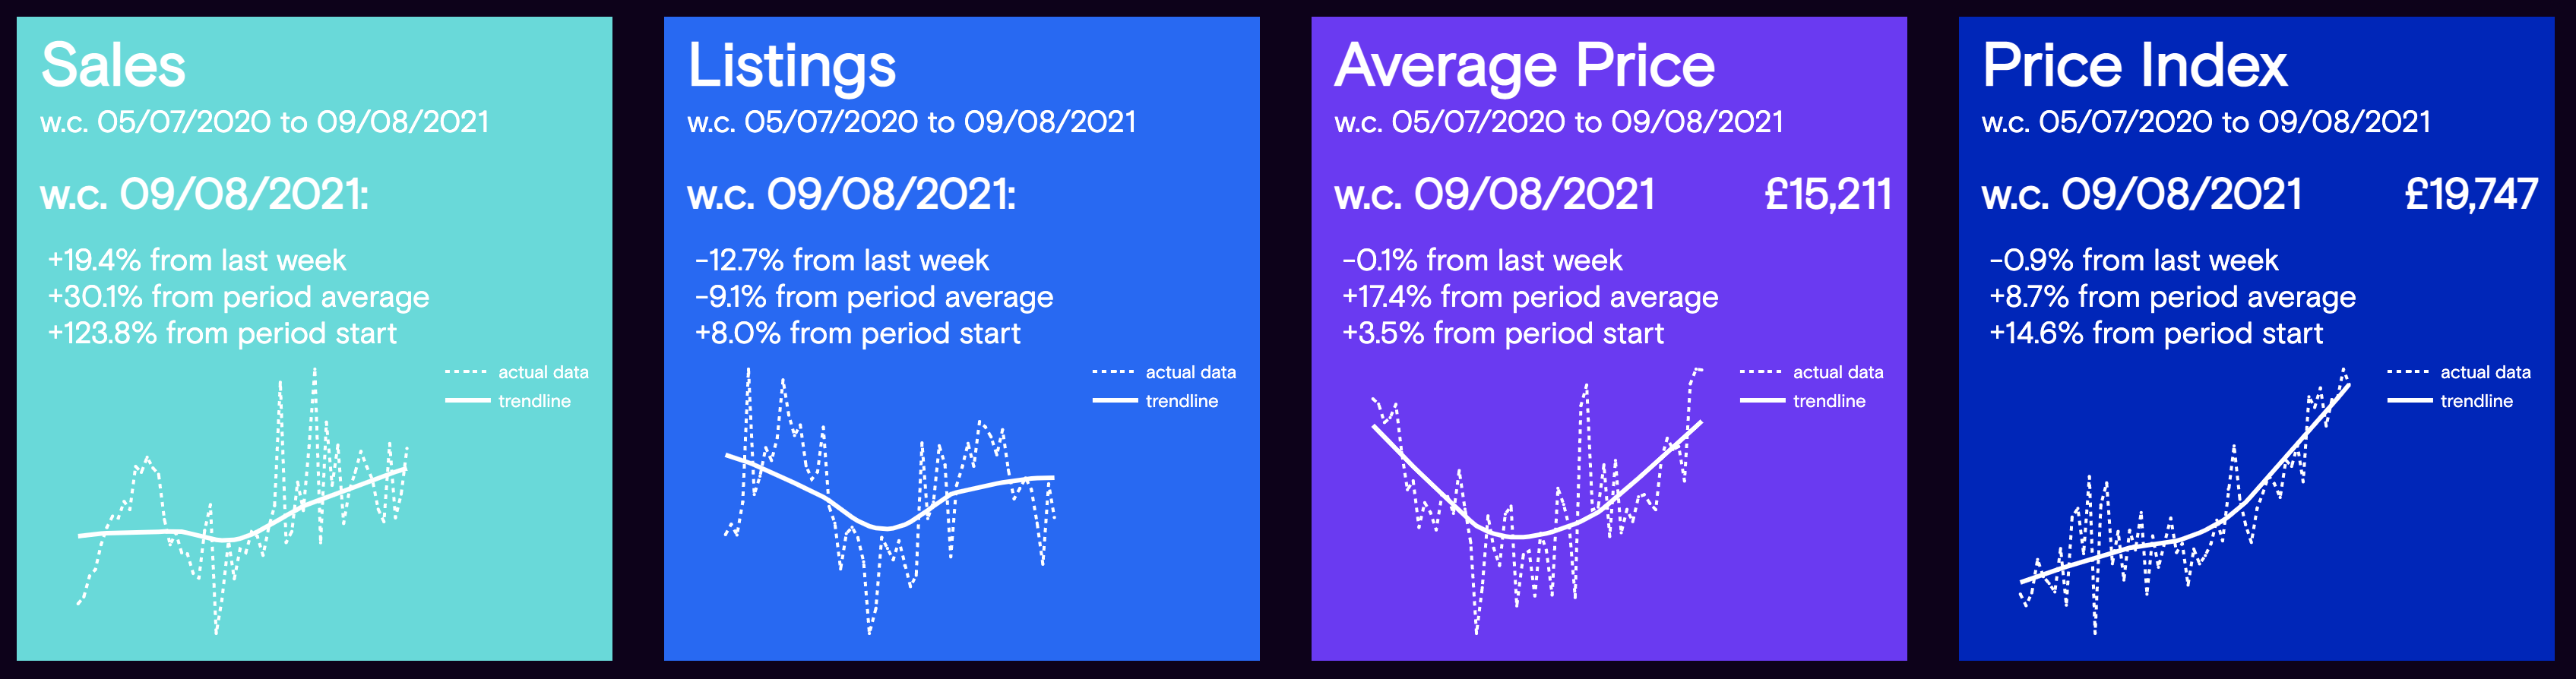
The panels below highlight the market dynamics during the week commencing August 9th in comparison to the previous week. At the same time, the panels also show the full year insight trend of the stated data period with a solid line and the dotted line depicts a week-by-week view:
Data powered by Cazana.
Insight in the Sales data panel above emphatically shows the uplift in used car sales over the previous week to be a very healthy +19.4%. This combined with the +11.3% improvement the previous week means that the market is on its way to recovering the sales lost during the “Euros” period and this boost may also be related to the end of the Olympic games on August 8th.
However, where sales have improved it is important to note that the volume of new retail adverts coming to the market has declined by -12.7%. This reflects the continued shortage of used cars reaching the market and it is a problem that needs to be interrogated very carefully to understand where lower vehicle volumes may impact on the ability to increase retail price and improve on profit per unit.
Putting the lens on retail pricing and the raw average retail price of a used car in the market had a tiny downward move of -0.1% in comparison to the previous week taking the price to £15,211. The Cazana Used Car Retail Price Index also declined by a nominal -0.9%, although it is important to note that the index has increased by +14.6% since this time last year which is quite an impressive improvement.
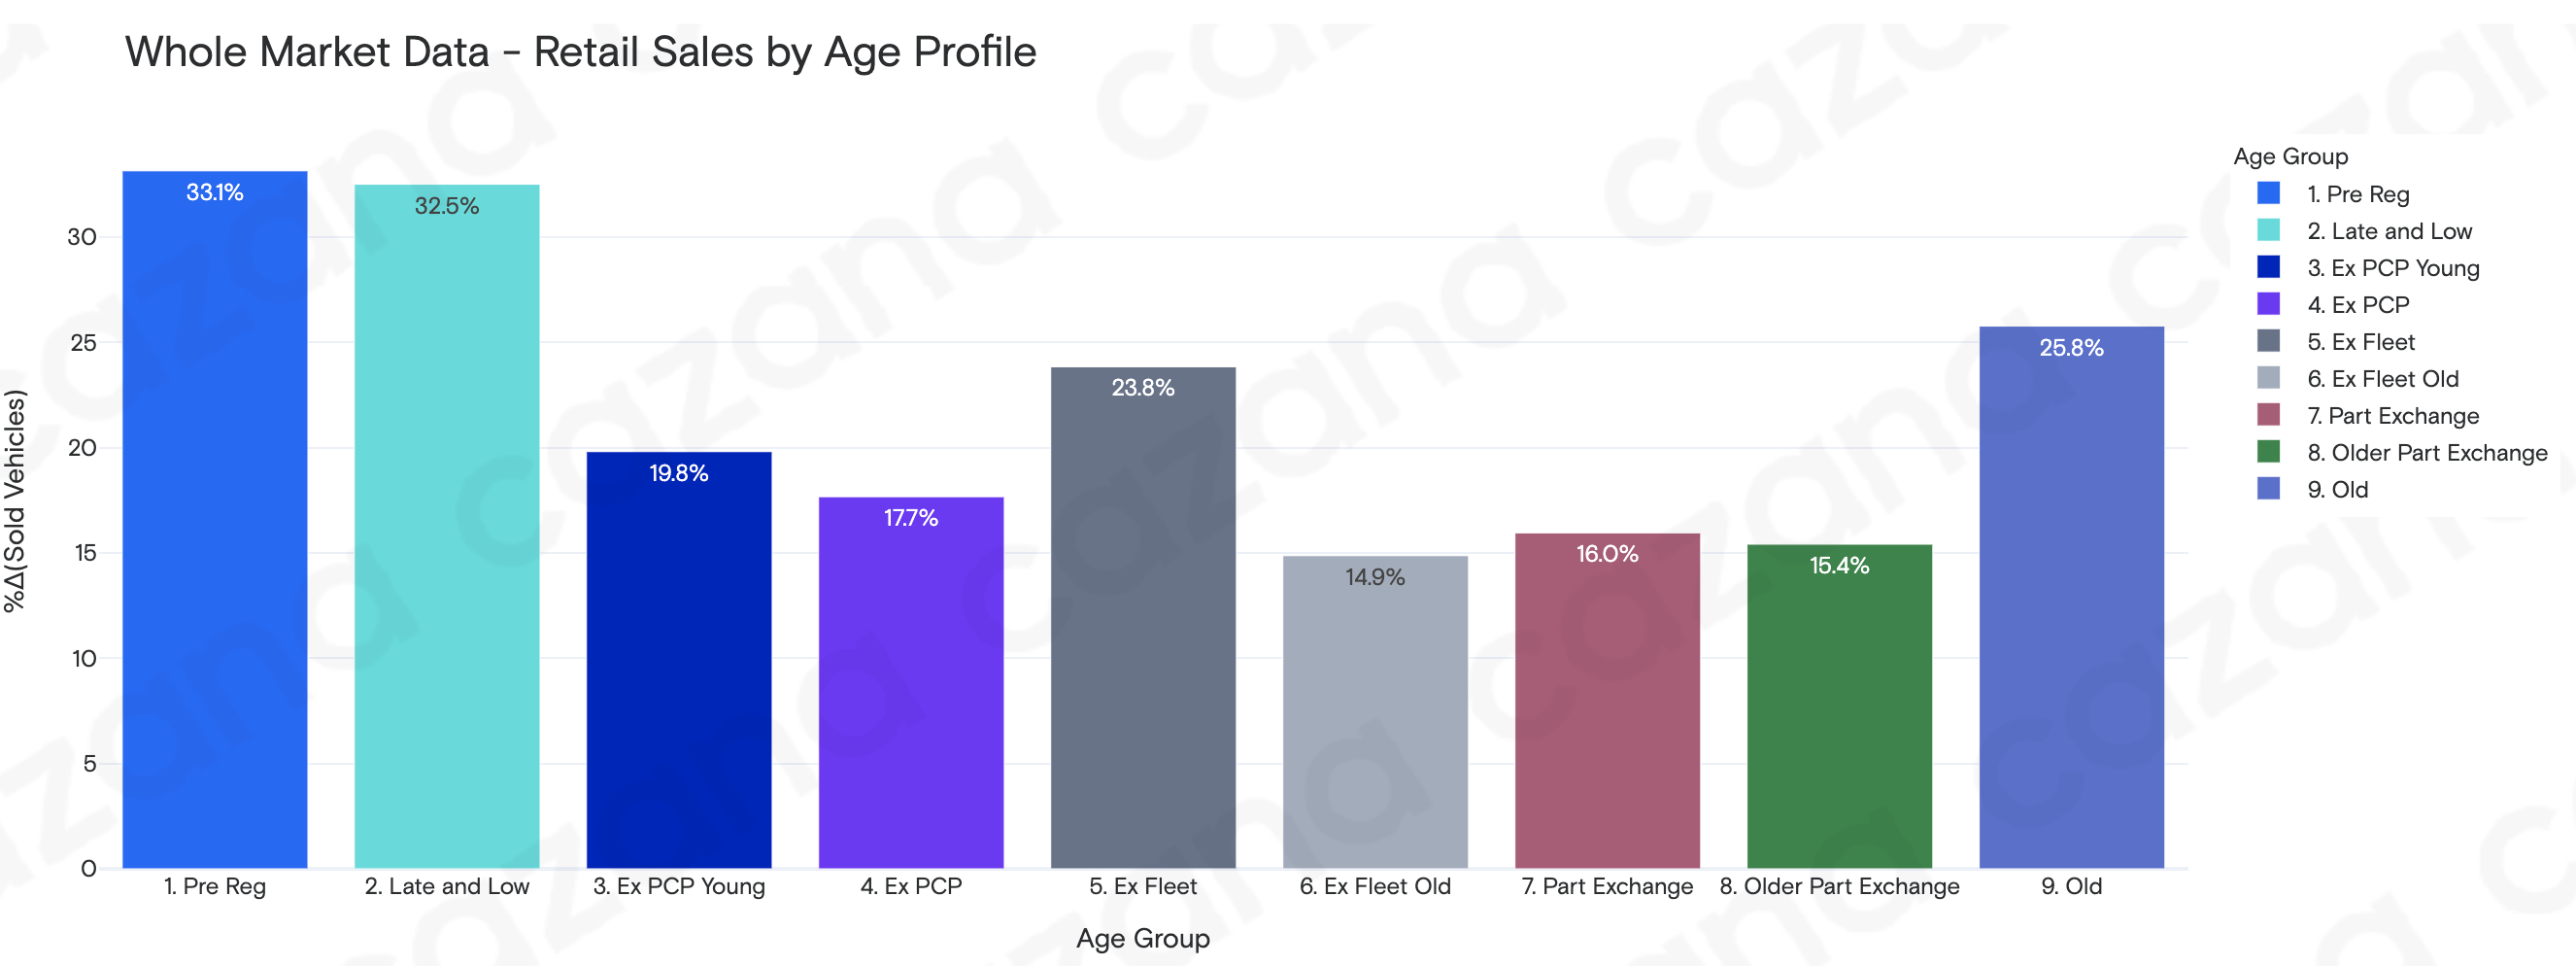
Given the significant increase in the number of used car sales week on week, the chart below looks to identify which age profile has gained the most: -
Data powered by Cazana.
This chart is very interesting as it clearly shows the key market activity, and it is surprising to see a +33.1% increase week on week for Pre Reg sales. However, this represents just 2.3% of the total used car sales volume for the week. The late and Low sector records the second largest increase in sales week on week at +32.5 percent and this age profile represents 9.4% of the weekly sales volume. It is the part exchange profile that has the largest share of weekly sales taking 38% of all sales and a lower increase of +16% in sales volumes week on week.
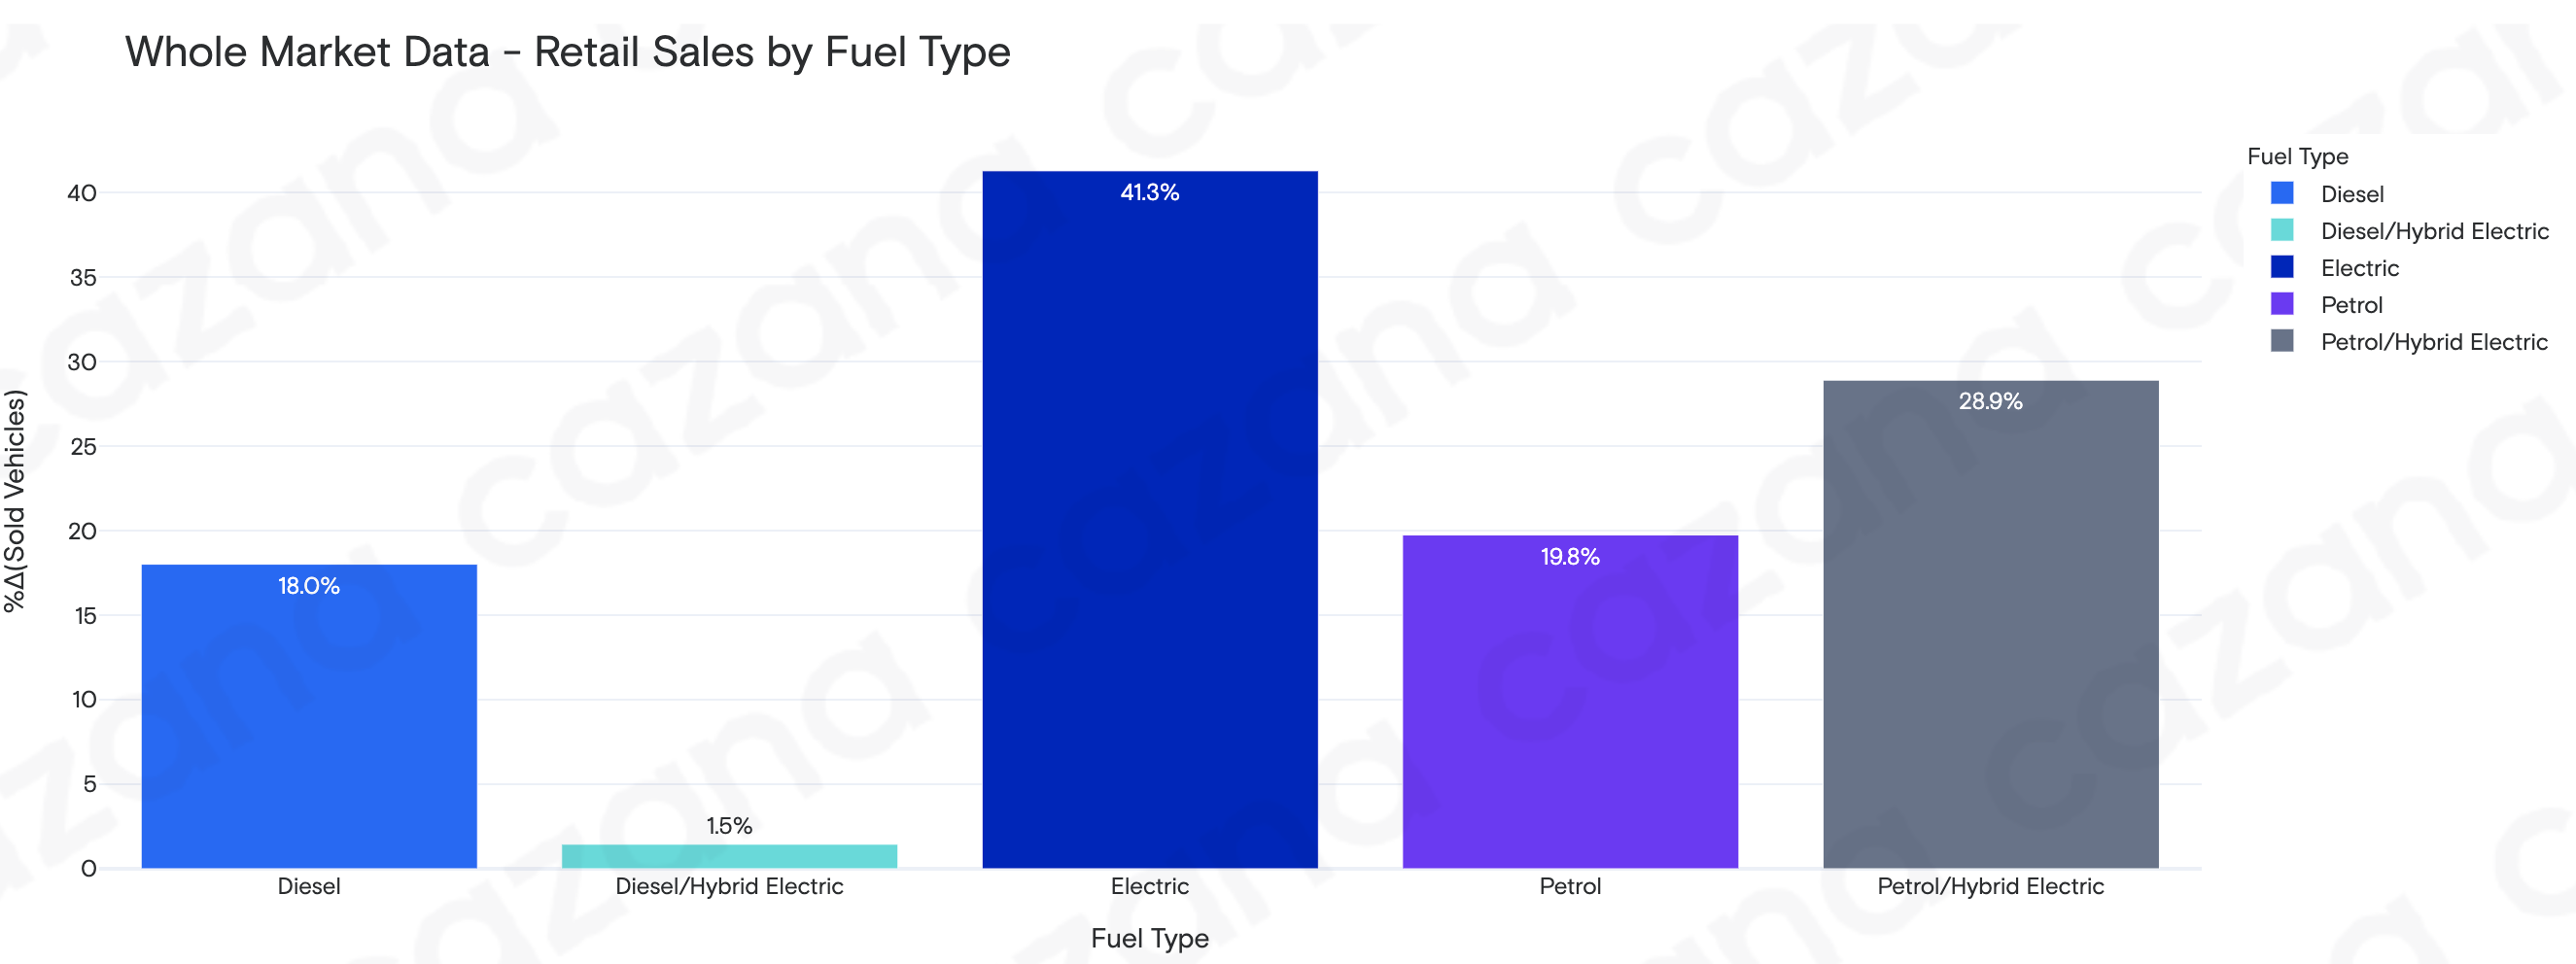
It is also of importance to see how sales of different fuel types have been affected and the chart below looks at the performance of used car sales week on week: -
Data powered by Cazana.
The insight in the previous chart is interesting as it shows that it is BEVs that have seen the largest upturn in sales week on week rising by a notable +41.3%. This represents a very small 0.9% of the total used cars sold during the week. The leader in this table is petrol vehicles which took 54% of all used car sales some 14 percentage points more than diesel powered cars in second place in market share terms. Petrol/hybrid cars also saw quite a jump in volumes week on week at +28.9% too. This insight suggests good demand from an environmentally aware consumer at the moment.
In summary, the market has been better than anticipated particularly from a used car perspective. Digital sales leads have been consistently good with footfall on the used car forecourts a little lighter than the retailers would like although online transactions have taken a slight upturn. The question of the depth of the problem with the supply of new car stock remains a hot topic although it is clear to all that the supply of used cars to the wholesale market has not improved. The coming week could be challenging as the holiday season heads towards the August bank holiday when many retail buyers tend to take a well-earned rest and that often means lower new and used car demand. Using Cazana real-time data will help identify where the commercial opportunities lie in the coming weeks. Whether your business is remarketing wholesale stock or retailing to the consumer, factual unedited data is key to success.
